 EN
EN FR
FR
Used vehicle prices continue to back off from ridiculous spike. But drop in gasoline prices was “transitory,” as we’re now learning at the pump.
By Wolf Richter,
The headline measure of the drop in purchasing power of the dollar, the Consumer Price Index (CPI), released today, confirmed that inflation is spreading deeper into the economy and is tearing into services.
As some product categories lost some of the inflation oomph, such as used vehicles and gasoline, others picked up oomph, such as housing, food, new vehicles, and air fares. It’s the arcade game of Inflation Whac-A-Mole in full swing, ridiculing the Fed’s assertion last year that it was temporary or transitory, when this horror show is now fully embedded in the US economy.
The overall Consumer Price Index (CPI-U) spiked by 8.3% in April compared to a year ago, the second worst since 1981, slightly less red-hot then the 8.5% spike in March, according to data released by the Bureau of Labor Statistics today. On a month-to-month basis, CPI jumped by 0.3%.
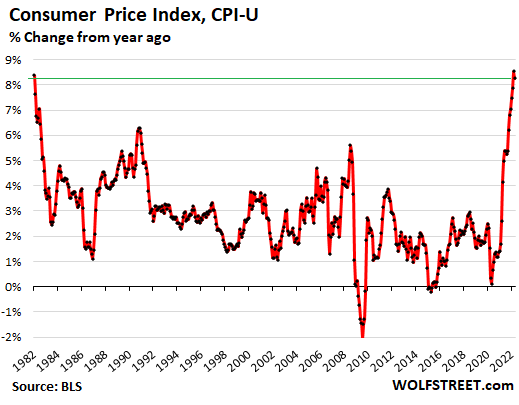
The year-over-year reading of CPI is never a smooth line, but zigzags up and down, as you can see in the chart above, because the year-over-year reading depends on two factors: The base figure last year, which creates the “base effect,” and the current figure.
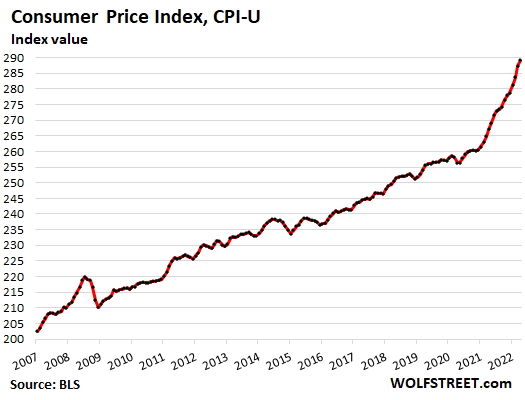
The index itself, not the year-over-year change in the index, is not subject the base effect, and is shows where this horror show is going and its cumulative effects:
For most people, actual inflation is a lot worse because CPI lags in picking up housing inflation, as we’ll see in a moment, and because CPI is skewed to the big spenders, meaning higher-income households. As Fed Vice Chair Lael Brainard pointed out earlier this year, lower income households face inflation that is much higher than CPI, and they feel it much more because they spend most of their income on necessities, where price increases have been particularly harsh.
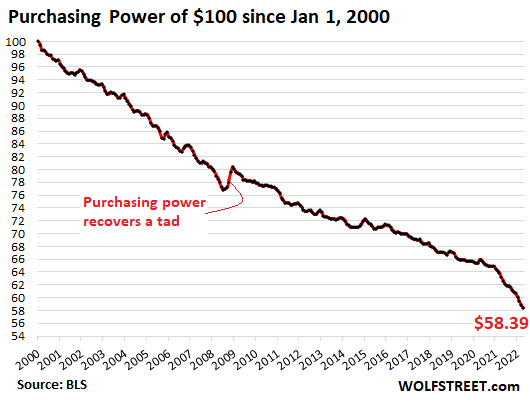
WHOOSH goes the Dollar’s Purchasing Power.
CPI inflation tracks the loss of the purchasing power of the consumer’s dollar, including the purchasing power of labor. It’s not a sign of growth or wealth or anything. In April, the purchasing power of $100 in January 2000 dropped to $58.39, and this is why these kinds of price increases ruin the mood of American consumers:
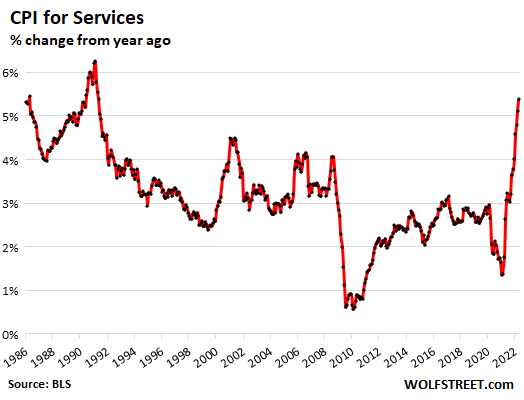
CPI inflation in services spikes.
The CPI for services spiked by 0.8% in April from March, sharply accelerating in recent months. This pushed the year-over-year increase to 5.4%, the worst since 1991. This includes housing costs, which we’ll get there in a moment, plus other items, such as:
- Health insurance: +10.4%
- Airline fares: +33%
- Lodging in hotels, motels: +22.6%
- Car and truck rental: +10.4%
- Delivery services: +13.9%
- Laundry and dry-cleaning services: +10.3%
CPIs for housing costs jump, trying to catch up.
The CPI for “shelter” is the largest component in the overall CPI, representing a basket of services that is designed to reflect housing costs as a service. It accounts for 32.5% of total CPI. The largest components in this basket are “Rent of primary residence,” accounting for 7.3% of total CPI, and “Owner’s equivalent rent of residence,” accounting for 23.8% of total CPI.
“Rent of primary residence” jumped by 0.6% for the month and by 4.8% year-over-year (red in the chart below). This tracks what tenants reported as the change in their actual rent payments, including in rent-controlled apartments.
“Owner’s equivalent rent of residences” jumped by 0.5% for the month and by 4.8% year-over-year (green line). This tracks the costs of homeownership as a service, based on what homeowners report that their home would rent for.
Both measures are still below the overall CPI and therefor are still holding down CPI, just less than before.
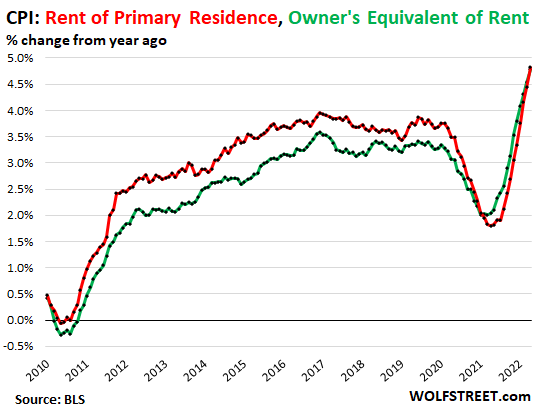
These two rent measures are lagging, and they will continue to rise as they catch up, even if housing inflation were to cool down a little over the next 12 months. So these housing components that account for nearly one-third of CPI will fuel CPI inflation well into 2023 (my discussion of this phenomenon).
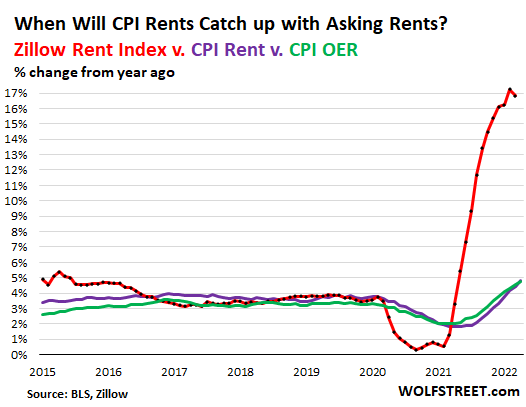
“Asking rents,” on the other hand, track advertised rents and are a measure of what landlords are asking for their apartments and houses that they have listed for rent. They do not reflect actual rents paid by tenants. But they show where the market is “today,” and these asking rents are red hot. The Zillow Rent Index has shot up 16.8% year-over-year, despite the slight dip in March (latest data available). Even though “rent of primary residence” (purple) and the “owner’s equivalent rent” (green) are now trying to catch up, they have a lot of catching up to do, and they’ll catch up some more, but with a lag:
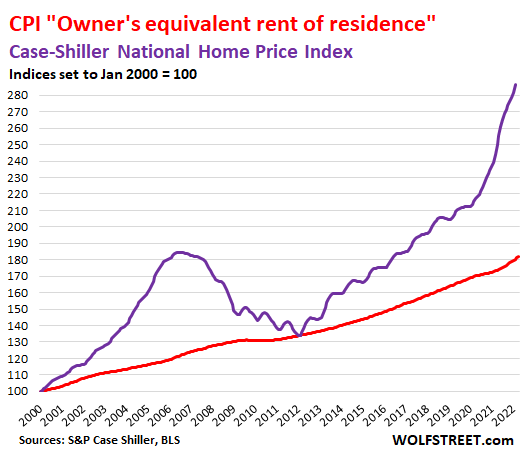
The cost of buying a house spiked by 19.8% year-over-year, according to the Case-Shiller Home Price Index (purple line below), reflecting the raging mania in The Most Splendid Housing Bubbles in America.
The CPI doesn’t track the cost of purchasing a house (an asset); but attempts to track the cost of the service that a home provides, namely “shelter,” which it does with its “owner’s equivalent or rent” (red). Both indices are set to 100 for January 2000:
Inflation in durable goods v. nondurable goods.
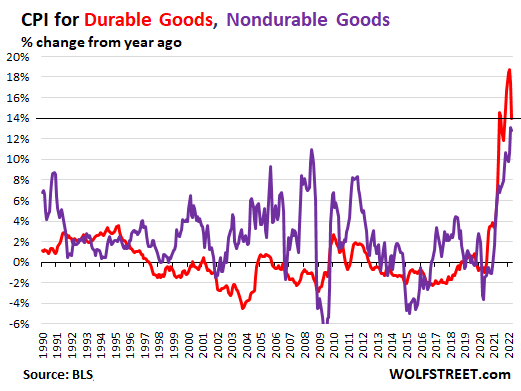
The CPI for durable goods – new vehicles, used vehicles, consumer electronics, furniture, appliances, etc. – was roughly flat in April from March. Year-over-year, it was up a stunning 14.0% (red line). The last five months had been the worst year-over-year spikes in the history of the monthly data going back to the 1950s amid ridiculous price spikes in used and new vehicles.
The CPI for nondurable goods – dominated by food, energy, and household supplies – declined by 2.5% for the month, whittling down the year-over-year spike to 12.8%, the second worst since 1980 (purple line):
“Food at home” CPI inflation spiked by 1.0% for the month and by 10.8% year-over-year. Major categories, and their year-over-year spikes in CPI inflation rates:
- Cereals and cereal products: 11.9%
- Beef and veal: 14.3%
- Pork: 13.7%
- Poultry: 15.3%
- Fish and seafood: 11.9%
- Eggs: 22.6%
- Fresh fruits: 8.3%
- Fresh vegetables: 6.2%
- Dairy and related products: 9.1%
- Coffee: 13.5%
- Fats and oils: 15.3%
- Baby food: 13.0%
“Food away from home” CPI jumped by 0.6% for the month and by 7.2% year-over-year, the most since 1981. This includes any food eaten outside the home, from snacks in vending machines via cafeteria food to high-end restaurants.
The Energy CPI fell in April from March, on a sharp pull-back in gasoline, now already obviated by a new reality as gasoline and diesel prices on Monday spiked to a new record high, rendering the drop in April “transitory,” to use Powell’s term. Compared to year ago, energy CPI spiked by 30.3%. This Energy CPI weights 8.3% of overall CPI. Some standouts:
- Gasoline: -6.1% for the month, but +43.6% year-over-year.
- Utility natural gas to the home: +3.1% for the month and +22.7% year-over-year.
- Electricity service: +0.7% for the month, +11.0% year-over-year.
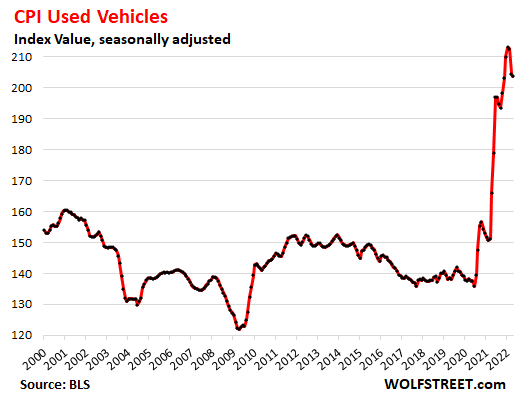
The used vehicle CPI declined for the third month in a row from the prior month, but this time just 0.4%, after the 3.8% drop in March, unwinding a small portion of the ridiculous price spike last year. Year-over-year, it was still up 22.7%. This chart shows the index value (not the year-over-year % change of the index value):
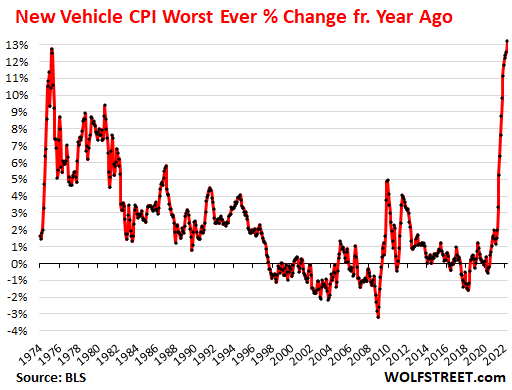
The new vehicle CPI spiked 1.1% for the month and by 13.2% year-over-year, the worst spike ever in the monthly data going back to the 1950s, amid widespread “above-sticker” prices and nearly empty dealer lots:
“Core” CPI.
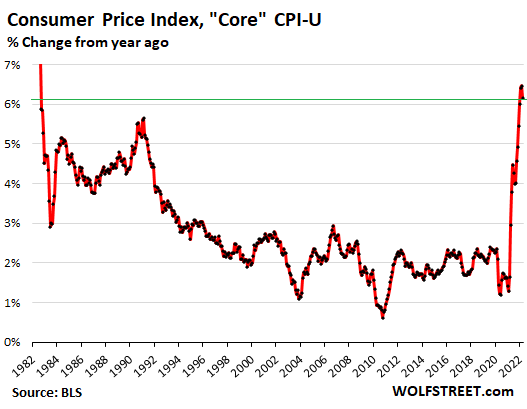
The “core” CPI, which excludes the volatile commodities-dependent food and energy components, attempts to measure inflation in the broader economy. It jumped by 0.6% for the month, accelerating from the prior two months (0.3% and 0.5%), and by 6.2% year-over-year, down a tad from March, and the second worst since 1982:
Source: WOLF STREET.

Your Tax Free Donations Are Appreciated and Help Fund our Volunteer Website
Disclaimer: We at Prepare for Change (PFC) bring you information that is not offered by the mainstream news, and therefore may seem controversial. The opinions, views, statements, and/or information we present are not necessarily promoted, endorsed, espoused, or agreed to by Prepare for Change, its leadership Council, members, those who work with PFC, or those who read its content. However, they are hopefully provocative. Please use discernment! Use logical thinking, your own intuition and your own connection with Source, Spirit and Natural Laws to help you determine what is true and what is not. By sharing information and seeding dialogue, it is our goal to raise consciousness and awareness of higher truths to free us from enslavement of the matrix in this material realm.


")


