 EN
EN FR
FR
By Wolf Richter,
Home price rise since 2012 “may be coming to an end”: Shiller. Biggest YoY drops: Seattle, San Francisco, Las Vegas, Phoenix, San Diego, Portland, Denver, Dallas.
“Probably what’s happening with the increase in home prices, it’s just seasonal, it’s the summer, typically it [the Case-Shiller National Home Price Index] is going up in the summer,” Robert Shiller, one of the guys that developed the Case-Shiller Home Price Index, told CNBC yesterday.
It “has been just growing ever since 2012, about 10 years in the US of steady growth in home prices,” he said. “But it may be coming to an end with the advent of this interest-rate rising cycle.”
It was the second time in the interview that Shiller used the phrase, “may be coming to an end.” Moments earlier he’d said: “The fear of interest rate increases has influenced people’s thinking — it’s not just the homeowners, it’s new buyers who wanted to get in before the interest rates went up even more. They wanted to lock in. So that’s been a positive influence on the market. But it’s coming to an end,” he said.
Today’s S&P CoreLogic Case-Shiller Home Price Index for “May” is a three-month moving average of home prices whose sales were entered into public records in March, April, and May – so that’s smack-dab in the spring selling season, when prices always rise from the prior month, even during Housing Bust 1. And given the lag in the Case-Shiller Index, the spring selling season is reported in the summer, and “typically it is going up in the summer,” as Shiller said.
On a month-to-month basis, the 20-City Case-Shiller Index rose 1.5% in May from April, but it wasn’t enough, and compared to a year ago, it fell by 1.7%, the third month in a row of year-over-year declines, and the biggest since 2012:
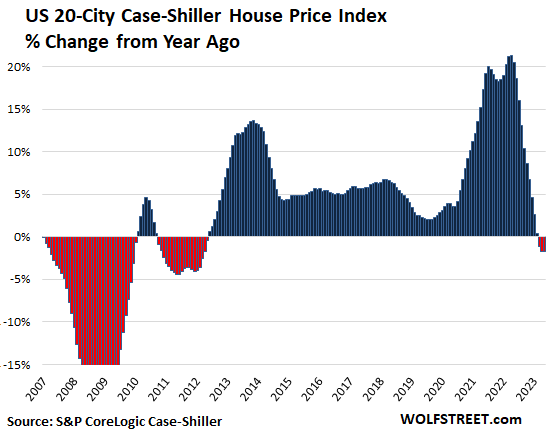
Half of the 20 cities in the index had year-over-year declines:
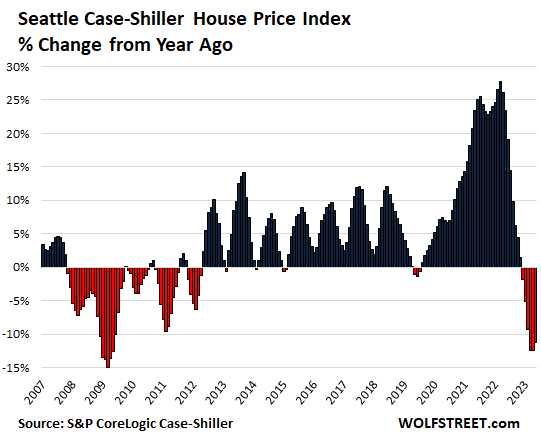
- Seattle: -11.3%
- San Francisco Bay Area: -11.0%
- Las Vegas: -7.8%
- Phoenix: -7.6%
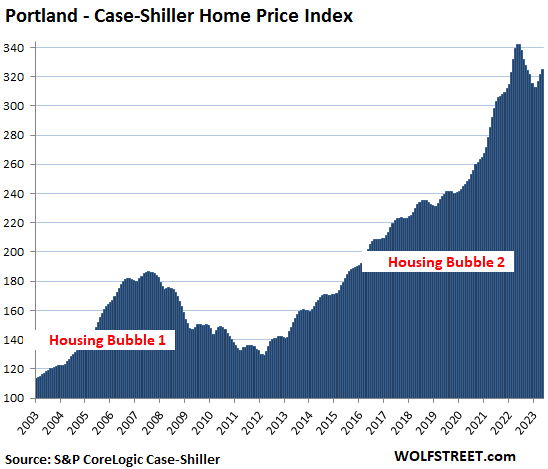
- Portland: -5.1%
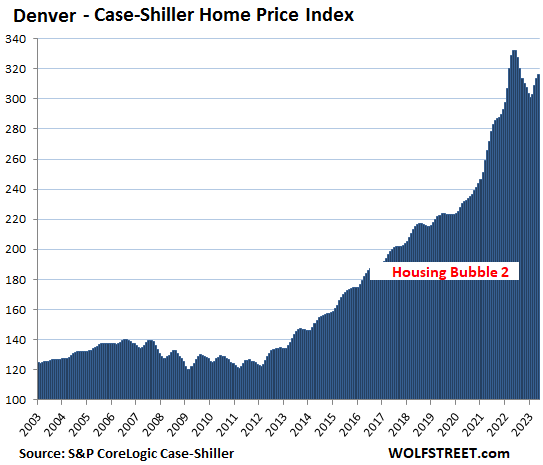
- Denver: -4.9%
- San Diego: -4.2%
- Dallas: -3.8%
- Los Angeles: -3.1%
- Washington DC: -0.1%
The most splendid housing bubbles by metro.
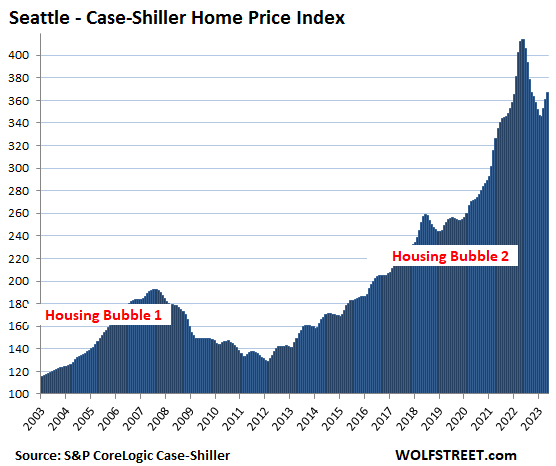
Seattle metro:
- Month to month: +1.9%.
- From the peak in May 2022: -11.3%.
- Year over year: -11.3%.
Seattle’s year-over-year decline of 11.3% was the 6th year-over-year decline in a row. Note during the Housing Bust, the waves of declines interrupted by year-over-year upticks:
And this is Seattle’s most splendid Housing Bubble:
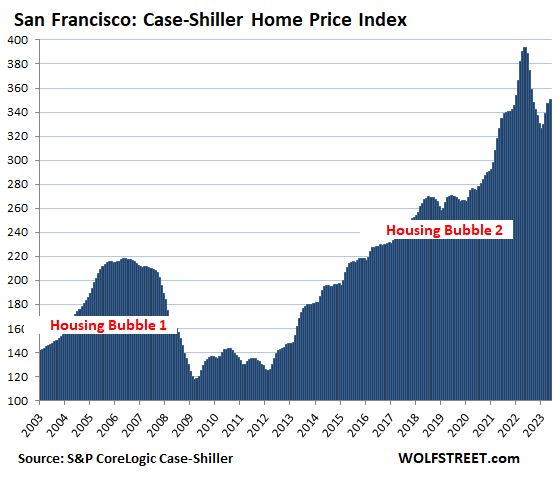
The San Francisco Bay Area:
- Month to month: +1.0%.
- From the peak in May 2022: -11.0%.
- Year over year: -11.0%.
This was the 7th month in a row of year-over-year declines. Also note the waves of declines interrupted by increases during the Housing Bust, on the WOLF STREET dictum, “Nothing Goes to Heck in a Straight Line”:
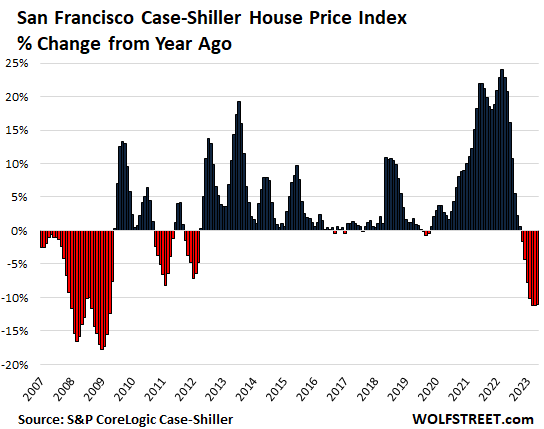
And here is the San Francisco Housing Bubble of single-family houses in its full glory.
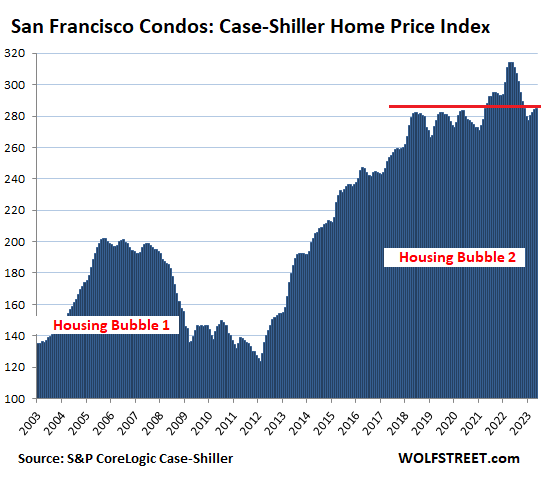
Condos in the San Francisco Bay Area have danced to a different drummer: They’re just a hair above where they’d first been in May 2018:
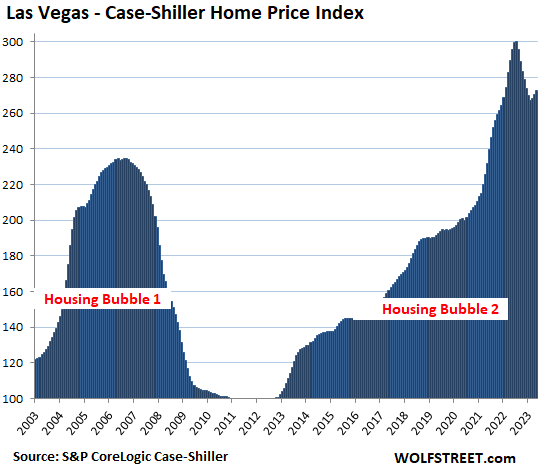
Las Vegas metro:
- Month to month: +0.9%.
- From the peak in July 2022: -9.1%.
- Year over year: -7.8%
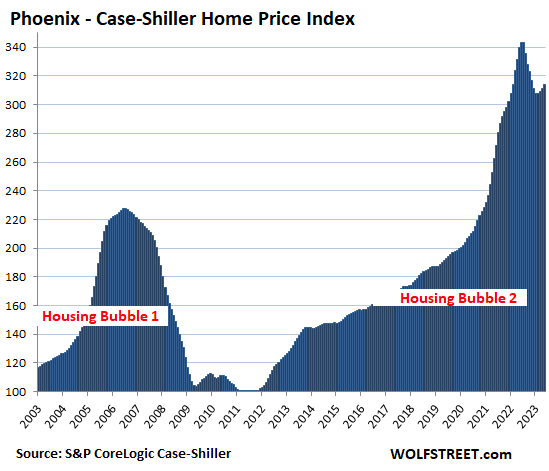
Phoenix metro:
- Month to month: +0.9%.
- From the peak in June: -8.6%.
- Year over year: -7.6%
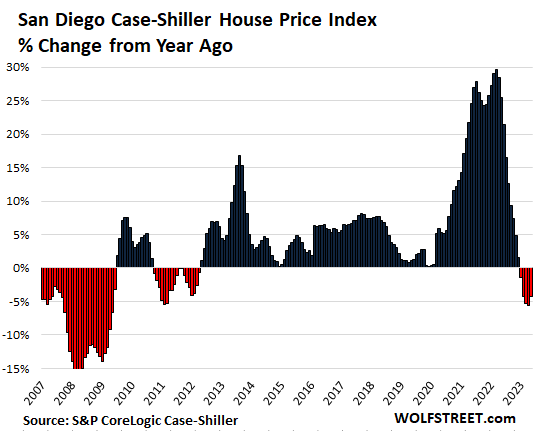
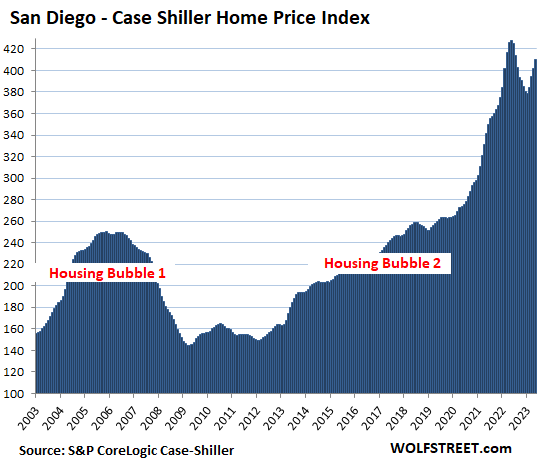
San Diego metro:
- Month to month: +1.9%.
- From the peak in May 2022: -4.2%.
- Year over year: -4.2%.
This was the 4th month in a row of year-over-year declines:
And San Diego’s gorgeous Housing Bubble:
Portland metro:
- Month to month: +1.0%.
- From the peak in May 2022: -5.1%.
- Year over year: -5.1%.
Denver metro:
- Month to month: +0.7%.
- From the peak in May 2022: -4.9%.
- Year over year: -4.9%.
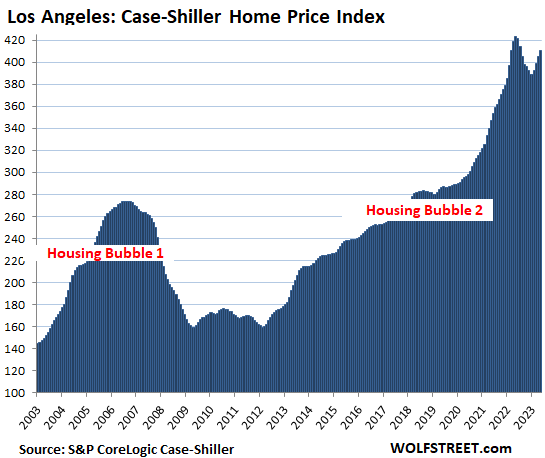
Los Angeles metro:
- Month to month: +1.2%.
- From the peak in May 2022: -3.1%.
- Year over year: -3.1%.
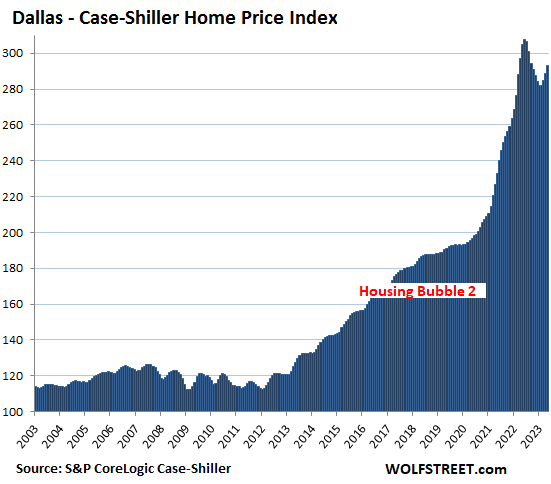
Dallas metro:
- Month to month: +1.6%.
- From the peak in June 2022: -4.8%.
- Year over year: -3.8%
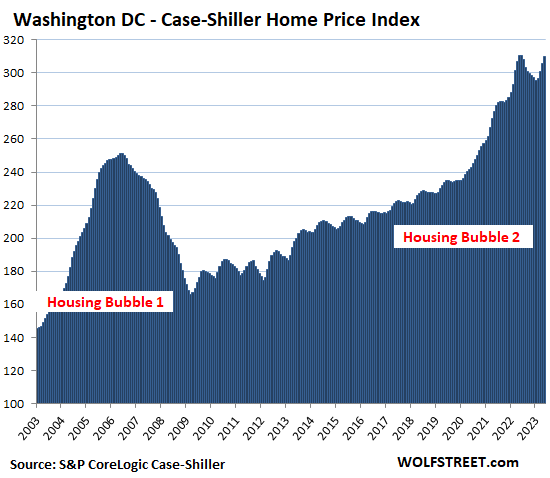
Washington D.C. metro:
- Month to month: +1.5%.
- From the peak in June 2022: -0.1%.
- Year over year: -0.1%
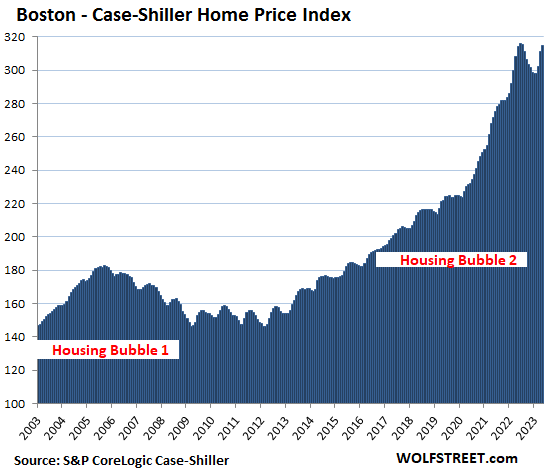
Boston metro:
- Month to month: +1.2%.
- From the peak in June 2022: -0.4%.
- Year over year: +0.2%
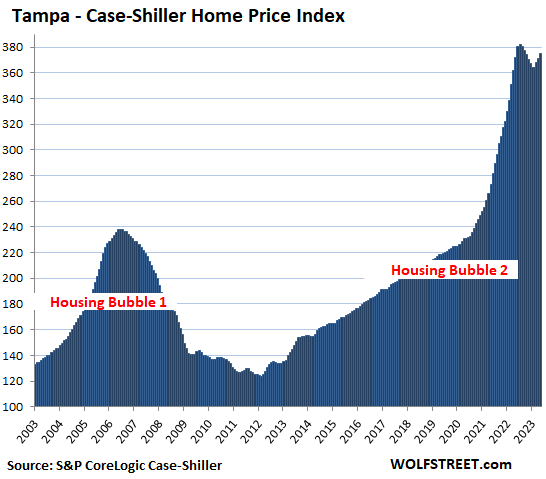
Tampa metro:
- Month to month: +1.0%.
- From peak in July 2022: -2.0%
- Year over year: +2.4%
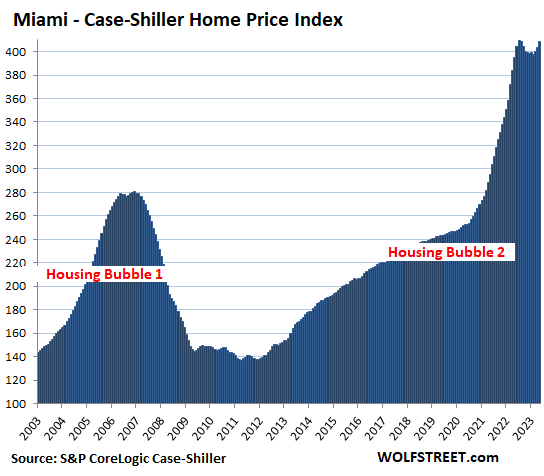
Miami metro:
- Month to month: +1.0%
- From peak in July 2022: -0.2%
- Year over year: +0.7%
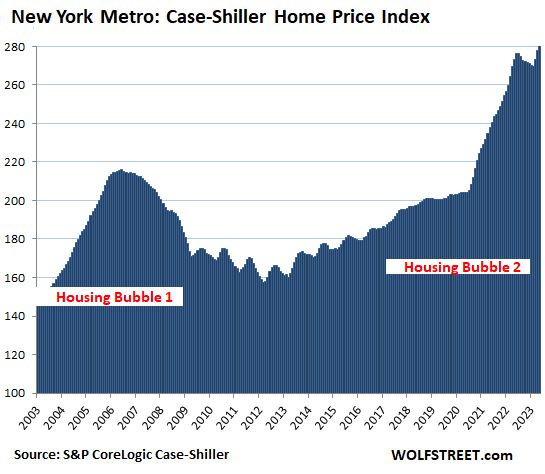
New York metro:
- Month to month: 1.9%.
- Reached new high in May
- Year over year: +3.5%
The Case-Shiller indices were set at 100 for the year 2000. The Los Angeles index value of 410 today is up by 310% since 2000. This makes Los Angeles the #1 most Splendid Housing Bubble in terms of price increases since 2000. San Diego is a rounding error behind, and Miami is a hair behind.
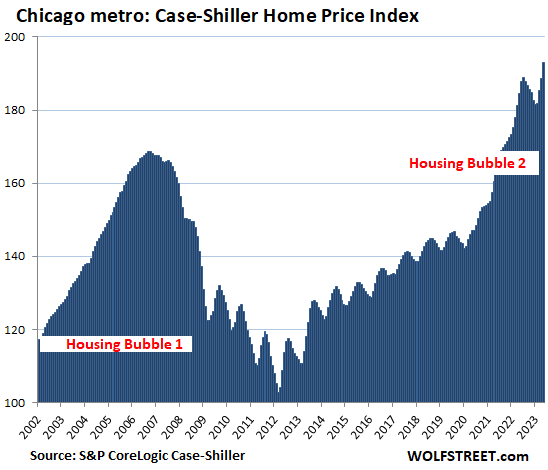
The remaining six markets in the Case Shiller index – Chicago, Charlotte, Minneapolis, Atlanta, Detroit, and Cleveland – have experienced far less house price inflation since 2000, and don’t qualify for this list of the Most Splendid Housing Bubbles.
Methodology. The Case-Shiller Index uses the “sales pairs” method, comparing sales in the current month to when the same houses sold previously. The price changes are weighted based on how long ago the prior sale occurred, and adjustments are made for home improvements and other factors (methodology). This “sales pairs” method makes the Case-Shiller index a more reliable indicator than median price indices, but it lags months behind.
And Chicago anyway. The index rose 2.3% in May from April and reached a new high, but is up “only” by 93% since 2000 — “only” if compared to the low end of the Most Splendid Housing Bubbles, the New York metro, which is up 180% since 2000, while the high end, Los Angeles, is up 310%:
Source: https://wolfstreet.com

Your Tax Free Donations Are Appreciated and Help Fund our Volunteer Website
Disclaimer: We at Prepare for Change (PFC) bring you information that is not offered by the mainstream news, and therefore may seem controversial. The opinions, views, statements, and/or information we present are not necessarily promoted, endorsed, espoused, or agreed to by Prepare for Change, its leadership Council, members, those who work with PFC, or those who read its content. However, they are hopefully provocative. Please use discernment! Use logical thinking, your own intuition and your own connection with Source, Spirit and Natural Laws to help you determine what is true and what is not. By sharing information and seeding dialogue, it is our goal to raise consciousness and awareness of higher truths to free us from enslavement of the matrix in this material realm.


")


")


The Cabal have been doing this on purpose so that they can pick up these vast amounts of real estate for nothing on the dollar. They will then build their mega cities (I mean prisons) for us to live in. Thanks for nothing.