 EN
EN FR
FRPrices in San Francisco Bay Area, Seattle, Chicago, New York at early-2018 levels. But Phoenix, Tampa, Charlotte show surging house-price inflation.
By Wolf Richter,
House prices in the five-county San Francisco Bay Area – the counties of San Francisco, San Mateo (northern part of Silicon Valley), Alameda and Contra Costa (East Bay), and Marin (North Bay) – were unchanged in December compared to November and were below where they’d first been in May 2018, according to the 20-City S&P CoreLogic Case-Shiller Home Price Index released today. Note the double peak:

The way the Case-Shiller Index is structured – based on “sales pairs,” it compares the sales price of a house that sold in the current month to the price of the same house when it sold previously – makes it a less volatile index than “median price” indices that can move up and down wildly. In addition, the index is a rolling three-month average: Today’s release includes closings that were entered into public records in October, November, and December.
The index was set at 100 for January 2000. Today’s index value for San Francisco of 267 means that house prices in the five-county Bay Area have soared 167% since 2000.
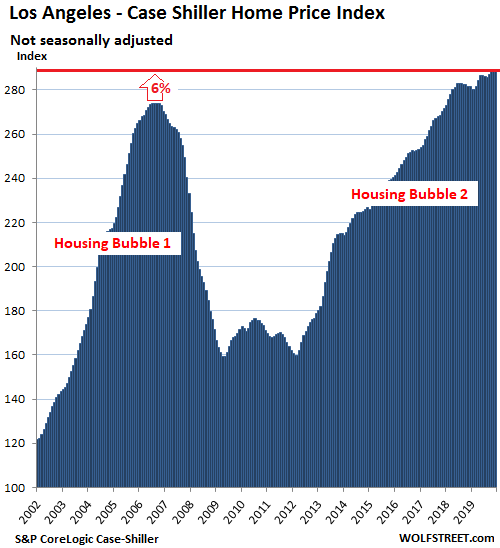
All charts here are on the same scale, with the vertical axis ranging from 100 to 290. Los Angeles is now within a hair of hitting the top of the scale, making it the market of the 20 in the index that has risen the most since 2000.
Los Angeles House Prices:
House prices in the Los Angeles metro remained flat in December compared to November, at a record level, and were up 2.7% from a year ago, and up 189% since January 2000:
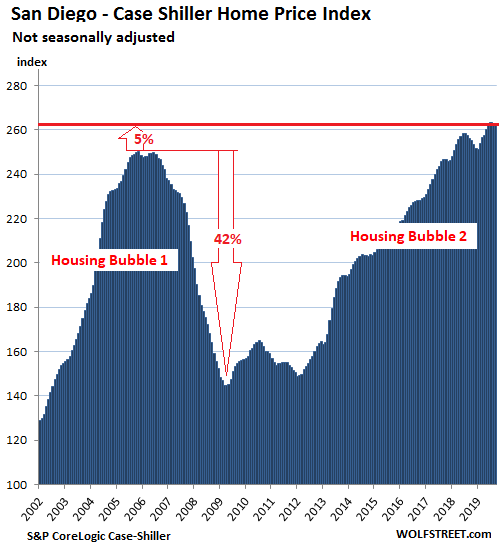
San Diego House Prices:
House prices in the San Diego metro have essentially remained flat for the past six months but are up 4.7% from December a year earlier due sharp price increases in the first half:
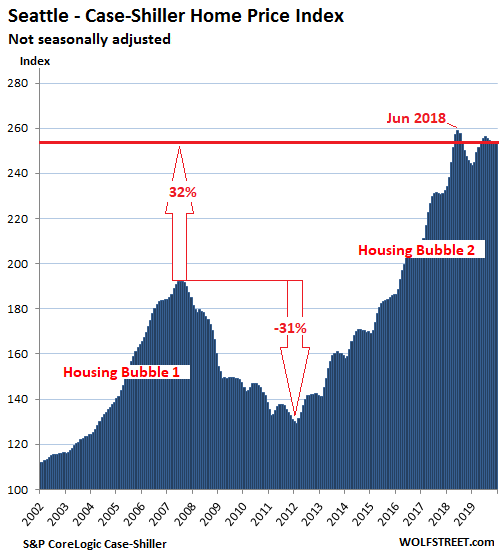
Seattle House Prices:
The Case-Shiller Index for the Seattle metro ticked up 0.2% in December from November but remains below where it had first been in May 2018. Also note the double peak:
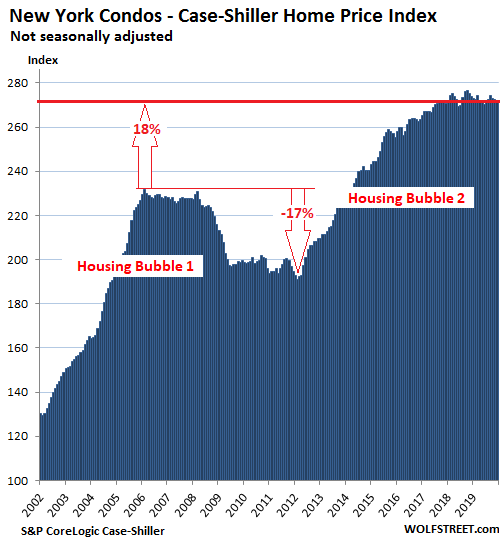
New York Condo Prices:
Case-Shiller uses a custom area for its New York City index that includes numerous counties in the states of New York, New Jersey, and Connecticut “with significant populations that commonly commute to New York City for employment purposes.” This area is far more diverse than Manhattan by itself, and the turmoil in the Manhattan condo and co-op market amid rampant oversupply of newly built high-end units is only one of many factors impacting the index.
Condo prices in the metro ticked down 0.5% in December from a year earlier and were back where they’d first been in January 2018:
This is “House-Price Inflation.”
Because the Case-Shiller Index compares the sales price of a house in the current month to the price of the same house when it sold previously, it tracks how many dollars it takes over time to buy the same house. The house didn’t get twice as big, but it just takes twice as many dollars to buy the same house. In other words, it measures the purchasing power of the dollar with regards to houses. This makes the Case-Shiller Index a good measure of “house-price inflation.”
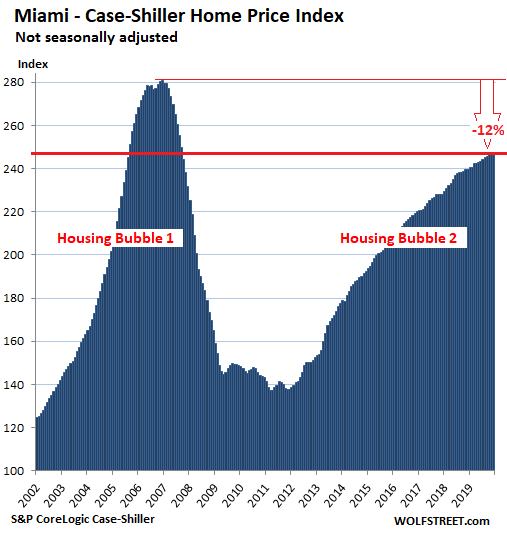
Miami House Prices:
Single-family house prices in the Miami metro edged up 0.1% in December from November and rose 3.2% year-over-year. The index is still down 12% from the craze at the end of 2006. Note that the index doesn’t track condos; but in the condo market, oversupply of newly built luxury units is creating very tough dynamics.
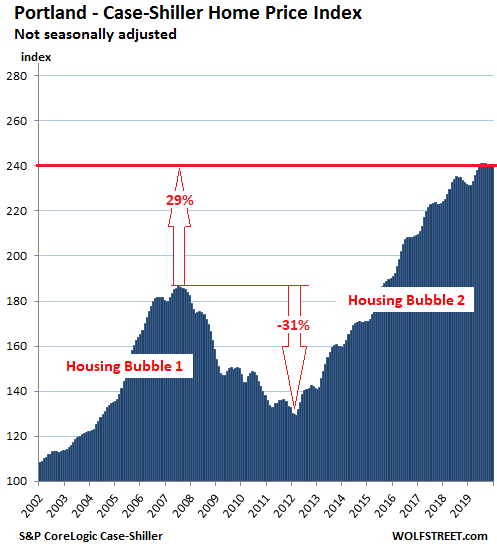
Portland House Prices:
House prices in the Portland metro ticked up 0.2% in December from November, have remained essentially flat for the past six months, and were up 3.7% year-over-year:
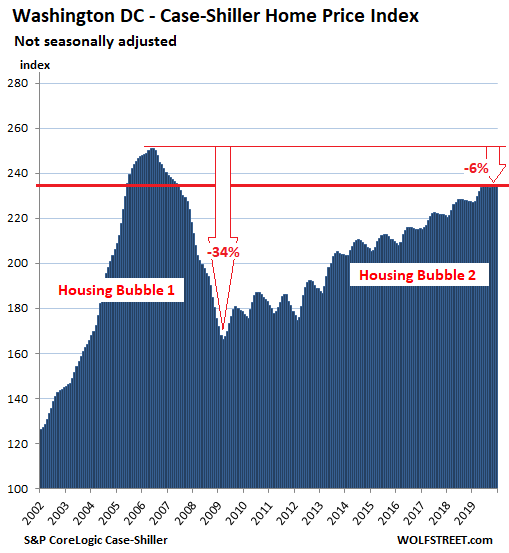
Washington DC:
House prices in the Washington D.C. metro ticked up 0.2% in December from November, have been essentially flat for seven months, and were up 3.4% year-over-year:
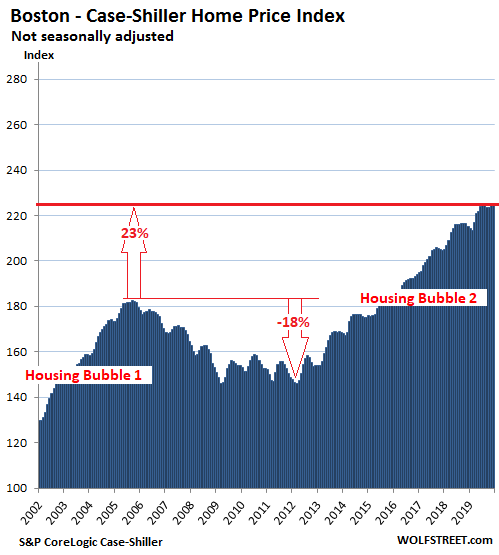
Boston House Prices:
The Case-Shiller index for the Boston metro has remained essentially flat for five months and was up 2.6% year-over-year. Boston’s index value of 256 means that house prices rose 156% since January 2000:
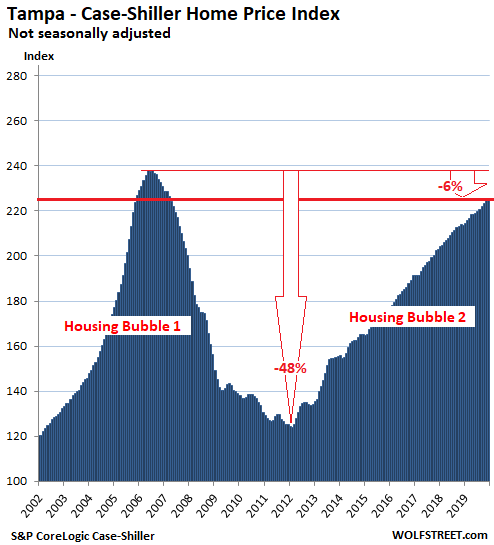
Tampa House Prices:
House prices in the Tampa metro inched up 0.1% in December from November and were up 5.2% year-over-year, the third-largest year-over-year increase of the metros in the 20-City index, behind Phoenix (+6.5%) and Charlotte (+5.3%):
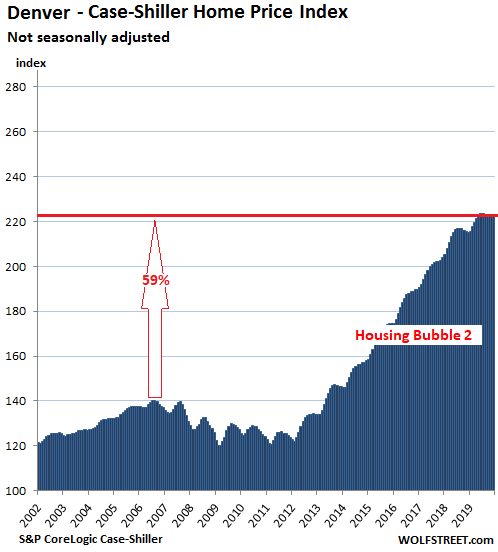
Denver House Prices:
House prices in the Denver metro ticked down in December from November, have been essentially flat since May 2019, and were up 3.7% compared to December 2018:
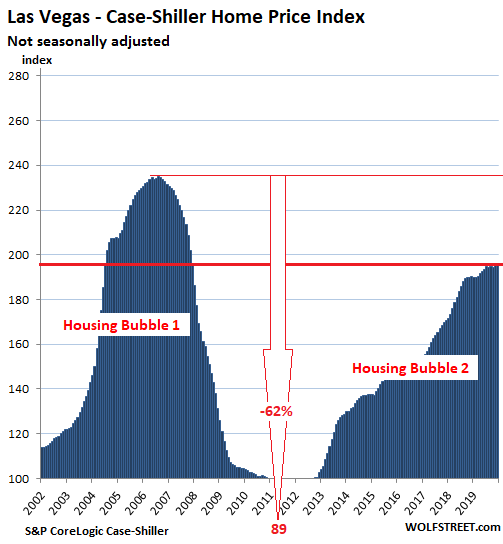
Las Vegas House Prices:
The Case-Shiller Index for the Las Vegas metro edged up 0.1% in December from November and rose 2.6% year-over-year, having been essentially flat for six months:
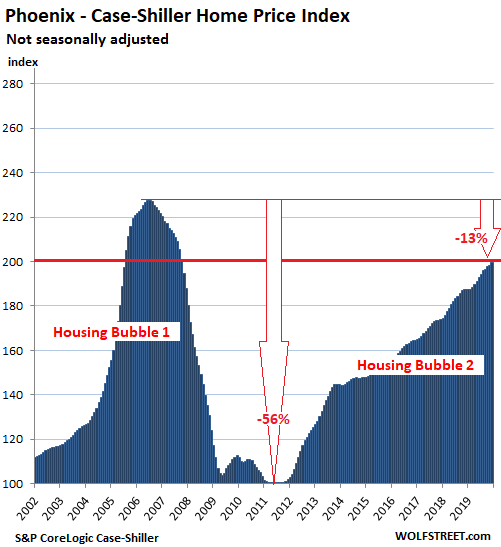
Phoenix House Prices:
House prices in the Phoenix metro rose 0.6% in December from November and were up 6.5% year-over-year, the #1 fastest year-over-year house-price inflation among the metros in the 20-City Index, homing in on the mad levels of 2006, having doubled since September 2011:
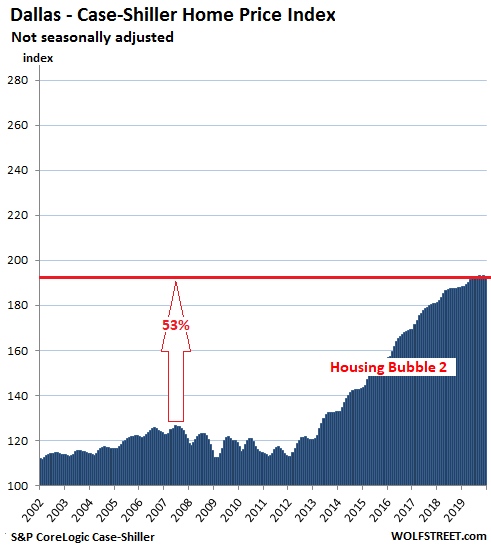
Dallas-Fort Worth House Prices:
The Case-Shiller Index for the Dallas-Fort Worth metro – the counties of Collin, Dallas, Delta, Denton, Ellis, Hunt, Johnson, Kaufman, Parker, Rockwall, Tarrant, and Wise – inched down 0.2% in December from November, which whittled the year-over-year gain down to 2.6%. The index value of 193 means that since 2000, house price inflation was 93%:
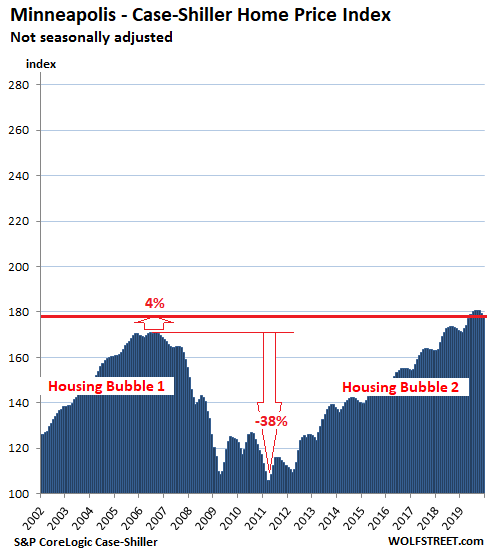
Minneapolis house prices:
House prices in the Minneapolis metro fell 0.6% in December from November but were up 3.7% year-over-year:
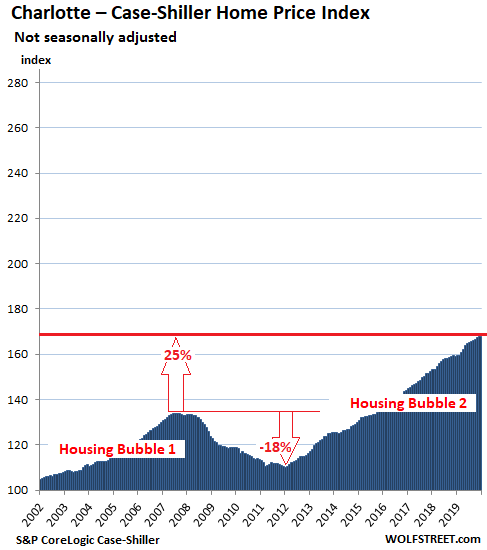
Charlotte house prices:
House prices in the Charlotte metro were flat in December from November but were up 5.3% year-over-year, the second-fastest house-price inflation in the 20-City Index, behind Phoenix:
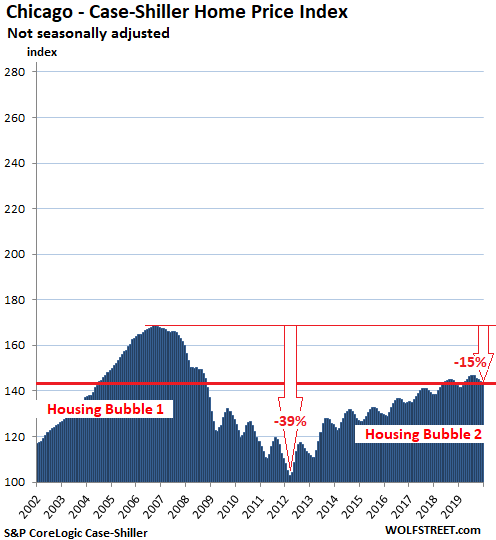
Chicago House Prices:
House prices in the Chicago metro – the counties of Cook, DeKalb, Du Page, Grundy, Kane, Kendal, McHenry, and Will – ticked down 0.1% in December from November and were up 1.0% from a year earlier, and back where they’d been in May 2018:
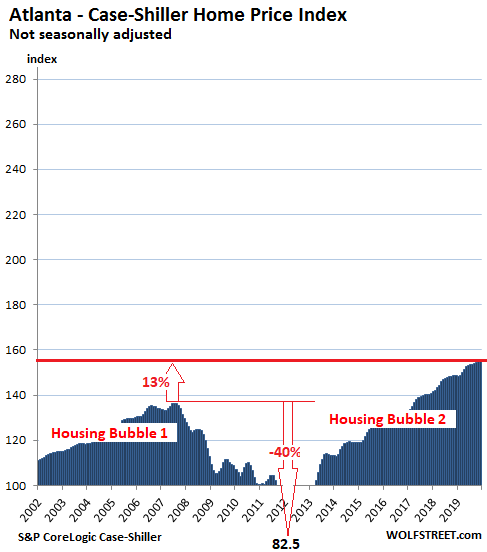
Atlanta house prices:
House prices in the Atlanta metro edged down 0.1% in December from November and were up 4.1% year-over-year. During Housing Bust 1, the index had plunged 40% to an index value of 82.5 in March 2012, back where it had been in 1996. But since then, it has surged 88%:
It’s clear from the way these charts look – the way they’re wildly different – that there is no unified “national” housing market, and that any measure of “national’ housing market averages out these wildly different local dynamics. But it’s also clear that these local markets are subject to national dynamics, such as the Fed’s monetary policies which have led to over a decade of interest rate repression, and hence low mortgage rates, and hence surging house price inflation.
It’s not only Chinese tourists, business travelers, and property buyers who’re not showing up, but also travelers from all over the world who’ve gotten second thoughts about sitting on a plane. Read… Coronavirus Slams Airbnb, Airlines, Hotels, Casinos, San Francisco, Other Hot Spots
Source: WOLF STREET.

Your Tax Free Donations Are Appreciated and Help Fund our Volunteer Website
Disclaimer: We at Prepare for Change (PFC) bring you information that is not offered by the mainstream news, and therefore may seem controversial. The opinions, views, statements, and/or information we present are not necessarily promoted, endorsed, espoused, or agreed to by Prepare for Change, its leadership Council, members, those who work with PFC, or those who read its content. However, they are hopefully provocative. Please use discernment! Use logical thinking, your own intuition and your own connection with Source, Spirit and Natural Laws to help you determine what is true and what is not. By sharing information and seeding dialogue, it is our goal to raise consciousness and awareness of higher truths to free us from enslavement of the matrix in this material realm.


What goes up must come down
Time to drink your own poison
@vulturecapitalists
#incurablegreed
As I had mentioned in a prior post, I think we are seeing signs of an imminent burst of the current bubble. To me it’s interesting that the Corona Virus is taking down China’s economy which is followed by struggles in other countries. Prepare For Change and Event Coming Soon have been warning us for at least 5 years to get ready, by enough supplies to hold over for about 2 weeks and have cash on hand. From what is shown above, this is the time to get our collective act together and prepare for what’s coming. Not out of fear but out of much needed change! Are your prepared?
when the crash happens all currencies will fail so it won’t matter if you don’t own your own farm.