 EN
EN FR
FR
It’s Gov’t Gone Wild! That includes The House, Senate, President and Federal Reserve.
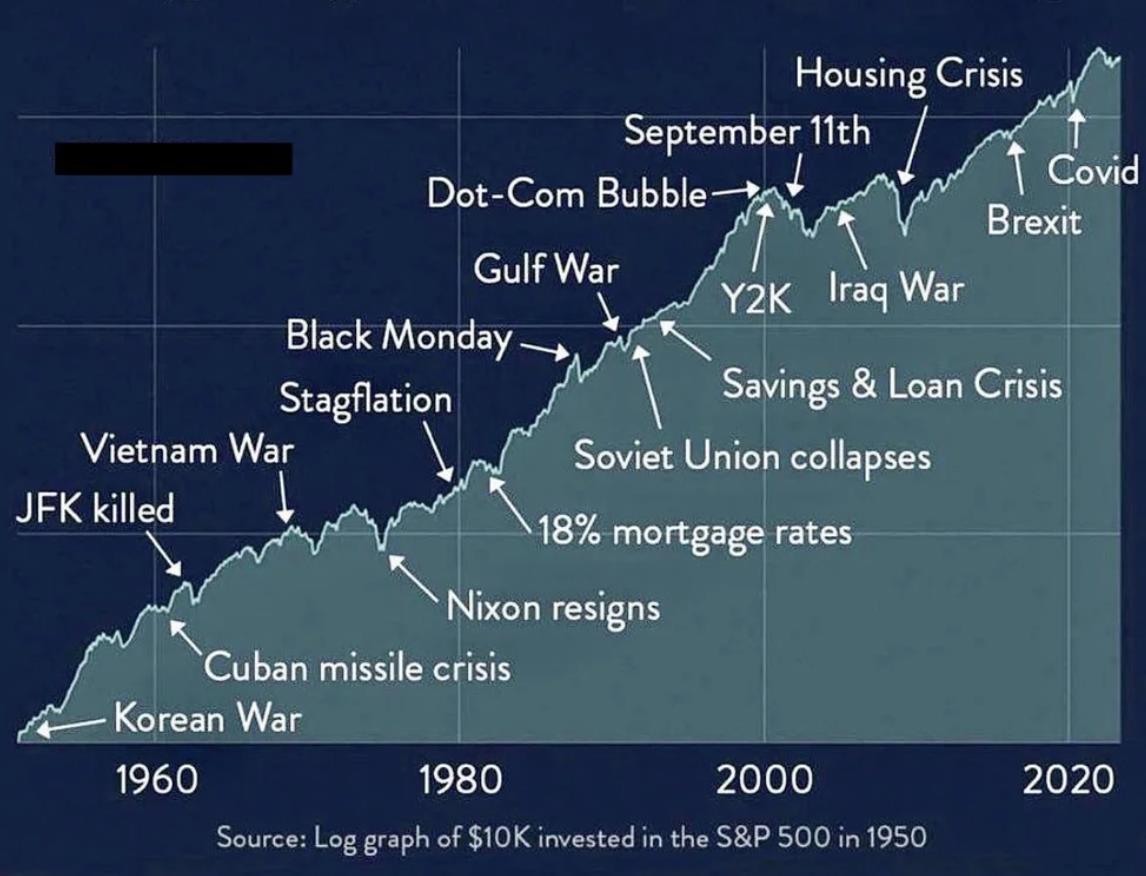
The purchasing power of the US Dollar was $1004.4 on 1915-03-01. By 2025-05-01, the purchasing power fell to $31.1, a loss of 97%. Public debt since the last year of GW Bush, Obama/Biden (with a brief hiatus with Trump) rose 317% since January 2009.

M2 Money printing grew 210% since January 2009.

U.S. debt hits $37T. Interest costs reach $1.1T. Deficit nears $1.9T. Both parties keep spending. Americans say stop.
The national debt just pierced $37.06 trillion as of July 5, 2025. That’s not a forecast. That’s locked and posted by the Treasury. The debt-to-GDP ratio now sits at 124%, with U.S. GDP projected near $29.8 trillion this year. That ratio passed post-WWII records and it’s showing no signs of turning.
This year’s deficit is already $1.36 trillion, and the Congressional Budget Office expects it to finish between $1.8 trillion and $1.9 trillion before September closes. No war. No stimulus. Just routine overspending. Washington calls it standard budgeting. The country is absorbing losses monthly.
Interest payments are swallowing everything. The Bureau of Economic Analysis pegs current annualized interest costs at $1.11 trillion. That tops defense. That tops Medicaid. That tops any discretionary item outside Social Security. Roughly 25% of all income tax revenue now goes to interest.
Yields on 10-year Treasuries climbed to 4.35% this week. Japan just sold off $78 billion in U.S. Treasury holdings. China shed $42 billion more. Fewer buyers. More auctions. The Federal Reserve steps in and props up what foreign buyers won’t. That’s not strength. That’s patchwork.
Spending isn’t slowing down. Democrats packed in $1.2 trillion for Medicaid expansion, food programs, clean energy subsidies and federal wage increases. Republicans countered with the One Big Beautiful Bill Act: $4.5 trillion in tax cuts and $1.4 trillion in added defense and infrastructure spending. Both parties signed the tab. No offsets. No clawbacks. Just scale.
The CBO estimates Trump’s bill alone will drive $3.4 trillion in added deficits over the next decade. Committee for a Responsible Federal Budget says the real figure may land closer to $3.9 trillion. That’s assuming no recession and flat interest rates. Reality bites harder than projections.
Americans are done watching. Pew’s June 2025 survey found 71% want a freeze on discretionary spending. Just 18% support new tax cuts without matching offsets. The public is asking for brakes. Capitol Hill keeps pressing the gas.
As Treasury floods the credit markets, borrowing costs spike across the board. Mortgages climb. Auto loans tighten. Small businesses get squeezed. When federal debt soaks up market oxygen, private investment chokes.
The spiral isn’t theoretical anymore. It’s visible. It’s repeating. Higher debt fuels higher interest. Higher interest feeds higher debt. The loop is locked. The pressure’s real.
And both parties are driving it.
They will always find a way to print more money.
The wealthy have a clear financial incentive to promote or shape crisis-related policies that cause M2 money supply surges, as these typically boost asset prices (like stocks and real estate) and offer low-cost credit, disproportionately enriching them.
In February 2021, the U.S. M2 money supply, encompassing cash, checking accounts, savings, and money market funds, skyrocketed by 26.9% year-over-year, marking the largest spike ever recorded. Propelled by the Federal Reserve’s aggressive quantitative easing and fiscal measures like the $2.2 trillion CARES Act, M2 expanded from $15.4 trillion in January 2020 to $19.7 trillion, adding $4.3 trillion in just over a year. This surge dwarfed previous peaks, such as World War II (~18% in 1943, driven by wartime financing), the Great Depression and 2008 financial crisis (~10%, fueled by recovery efforts and bailouts), and the post-Vietnam War era (~9% in 1976, amid high inflation and deficits).
Such significant M2 increases, often triggered by expansive monetary and fiscal policies, tend to widen wealth inequality by inflating the value of assets primarily held by the affluent (e.g., ~89% of corporate stock, per Federal Reserve data), while providing them early access to cheap credit, leaving wage-earners more vulnerable to inflation’s effects. Below, I’ll briefly explain how these surges often contribute to wealth inequality, focusing on the top five M2 spike years (2021, 1943, 2009, 1976) and their economic context.
- Asset Price Inflation
M2 surges increase liquidity, often flowing into financial markets (stocks, real estate, bonds). The wealthy, who hold a disproportionate share of assets, benefit from rising asset prices.
2021 (26.9% spike)
The Federal Reserve’s stimulus and low interest rates fueled a stock market boom and housing price surge. The top 10% of households, owning ~89% of corporate stock (Federal Reserve data), saw significant wealth gains.
2009 (10% spike)
Post-financial crisis QE boosted asset prices, benefiting wealthier households with investment portfolios while many middle-class households struggled with housing market recovery.
- Access to Credit
M2 spikes often coincide with low interest rates, making borrowing cheaper. Wealthy individuals and corporations can leverage cheap credit to invest in businesses, real estate, or financial instruments, amplifying returns.
1983 (~8% spike): Lower rates and economic recovery favored investors and business owners, who could borrow to expand operations or invest, while wage earners saw slower gains.
- Inflation and Real Wages
Large M2 increases can lead to inflation, which erodes purchasing power for wage-dependent households but benefits those with appreciating assets. The wealthy, with diversified investments, are better insulated from inflation’s downsides.
1976 (~8-9% spike): High inflation eroded real wages, but those with assets (stocks, real estate) saw wealth preservation or growth, widening inequality.
1943 (~18% spike): Wartime spending increased deficits and money supply, inflating asset values for industrialists and investors, though rationing and wage controls limited broader benefits.
- Cantillon Effect
New money enters the economy unevenly, benefiting those closest to the source (e.g., banks, corporations, investors) first. The wealthy, with ties to financial institutions, gain early access to liquidity, investing before prices rise.
This dynamic was evident in 2021 and 2009, where financial institutions and corporations accessed Fed liquidity early, boosting asset-heavy portfolios.
Sources:
https://fiscaldata.treasury.gov/americas-finance-guide/national-debt
https://fred.stlouisfed.org/series/A091RC1Q027SBEA
https://www.cbo.gov/publication/61537
https://www.crfb.org/blogs/interest-costs-could-explode-high-rates-and-more-debt
https://tradingeconomics.com/united-states/government-bond-yield

Your Tax Free Donations Are Appreciated and Help Fund our Volunteer Website
Disclaimer: We at Prepare for Change (PFC) bring you information that is not offered by the mainstream news, and therefore may seem controversial. The opinions, views, statements, and/or information we present are not necessarily promoted, endorsed, espoused, or agreed to by Prepare for Change, its leadership Council, members, those who work with PFC, or those who read its content. However, they are hopefully provocative. Please use discernment! Use logical thinking, your own intuition and your own connection with Source, Spirit and Natural Laws to help you determine what is true and what is not. By sharing information and seeding dialogue, it is our goal to raise consciousness and awareness of higher truths to free us from enslavement of the matrix in this material realm.


Breaking News Intel – 7/10/25 Truth, Honor & Integrity show – Thomas Williams
Defense Intelligence Agency, states Israel was Obliterated recently after they attacked Iran.
and set Israel back 20 plus years. Russia , China , North Korea , Turkey, Egypt and Saudi
Arabia Join forces and warn Usa and Israel if they attack Iran again , Israel will cease to exist .
Listen / download from website below or listen on Spreaker
7/10/25 Truth, Honor & Integrity show
https://thi-show.com/
One last mega party before taxpayers find out their screwed for the bill, and damn all posterity to pay for it! Grandfather Stalking Wolf said it very clearly, "the white man (Western Civilization) are those that would feed their children with their grandchildren". Meaning our treasonous leaders would financially enslave all future generations for profit now. It is a kind of madness like leaders desperate to retain power even at the cost of their own nation. If given choice of their own lives saved or the loss of their nation, they would pick themselves. Like an immature spoiled child. Kings of old would gladly die to save their nation, without question. They had honor!
Grandfather: A Native American’s Lifelong search for Truth by Tom Brown Jr
https://projectavalon.net/lib/Tom%20Brown%20Jr.%20-%20Grandfather.pdf