 EN
EN FR
FR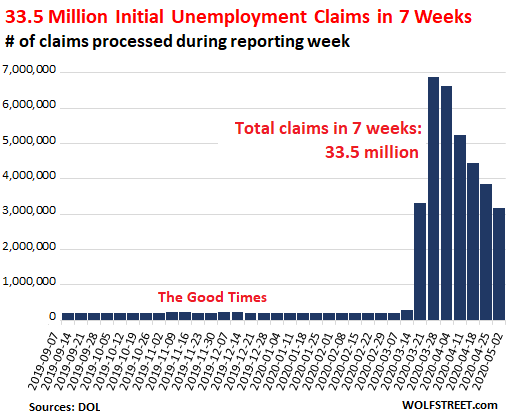
By Wolf Ritcher,
State unemployment offices have processed a gut-wrenching 33.48 million initial claims for unemployment insurance over the seven reporting weeks since mid-March. In the week ended May 2, state unemployment offices have processed 3.169 million unemployment claims, seasonally adjusted, according to the US Department of Labor this morning.
Each weekly number of unemployment claims over the past seven weeks blew away the weekly records of the prior unemployment crises in 1982 and 2009; today’s claims were nearly five times the magnitude of the prior record spikes. So initial unemployment claims are falling, but they’re still at a catastrophic level.
The layoff announcements by larger companies continue on a daily basis. Yesterday, Uber announced that it would lay off 3,700 people; Haliburton announced that it would lay off 1,000 people at its corporate headquarters, after having already laid of thousands of people elsewhere; the Natural History Museum in New York City announced it would lay off 450 people; etc. etc. It’s a loud and terrible drumbeat. Thousands of smaller companies are laying off people without media attention.
In California and many other states, systems are now ready to process unemployment insurance claims by the self-employed and contract workers that have become eligible to file for unemployment insurance under the provisions in the stimulus package. And some of those claims are now being included in the data.
“Insured Unemployed” spike to another horrific record.
Someone who filed an “initial claim” for Unemployment Insurance (UI) and a week later still doesn’t have a job is added to “insured unemployment” – also called “continued claims.” This lags by one week.
The number of people that make up the “insured unemployed” spiked to 22.647 million for the week ending April 25, about 3.5 times the record of the era before The Virus – 6.63 million in May of 2009:
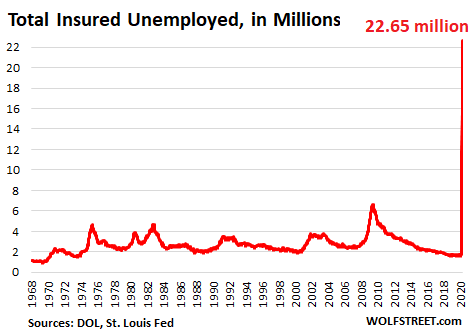
The “insured unemployment rate” for the week ended April 25 spiked to 15.5%. The record in the era before The Virus was 7.0% in May 1975.
At the state level, the data for the insured unemployment rate lags one week. The table below shows the 13 states where the insured unemployment rate for the week ending April 18 was higher than the national average of 15.5%, according to the Labor Department today. New Jersey is on the list because it is within a rounding error of the national average. All other states were below the national average, including California (10.9%), Texas (7.8%), and Florida (6.3%) which has been struggling to catch up processing unemployment claims.
| Insured Unemployment Rate by State | Week ending Apr 18 | Week ending Apr 11 | |
| 1 | Vermont | 25.2% | 21.8% |
| 2 | West Virginia | 21.9% | 14.4% |
| 3 | Michigan | 21.7% | 21.8% |
| 4 | Rhode Island | 20.4% | 16.8% |
| 5 | Nevada | 19.9% | 16.8% |
| 6 | Connecticut | 18.7% | 18.5% |
| 7 | Puerto Rico | 17.9% | 12.8% |
| 8 | Georgia | 17.3% | 14.0% |
| 9 | New York | 17.2% | 14.4% |
| 10 | Washington | 17.1% | 16.0% |
| 11 | Alaska | 16.9% | 15.6% |
| 12 | Louisiana | 15.9% | 13.0% |
| 13 | Pennsylvania | 15.7% | 18.5% |
| 14 | New Jersey | 15.4% | 13.8% |
This “insured unemployment rate” is very different from the household-survey-based unemployment rates in the monthly jobs report, which attempt to show the percentage of people in the labor force who are actively trying to find employment, including gig work. Not all of the people looking for work are receiving unemployment benefits, and so the unemployment rates in the jobs report, when they finally catch up, are higher than the “insured unemployment rate.” We will find out on Friday what that rate looked like for April.
The 25 states with the most initial claims, week ended May 2.
California is back in first place, replacing Florida, which had moved into first place last week as it was finally catching up processing claims. During the initial burst in March, California had reported over 1 million claims in a single week. This has been dropping since then. The state unemployment office (EDD) has started to process applications by previously excluded gig workers, and those claims are starting to be included:
| Top 25 States for Initial Claims, week ended May 2 | ||
| 1 | California | 318,064 |
| 2 | Texas | 247,179 |
| 3 | Georgia | 226,884 |
| 4 | New York | 195,242 |
| 5 | Florida | 173,191 |
| 6 | Washington | 109,167 |
| 7 | Pennsylvania | 96,603 |
| 8 | New Jersey | 87,540 |
| 9 | North Carolina | 84,716 |
| 10 | Kentucky | 80,060 |
| 11 | Illinois | 74,476 |
| 12 | Michigan | 68,952 |
| 13 | Oklahoma | 68,237 |
| 14 | Maryland | 65262 |
| 15 | Virginia | 61,138 |
| 16 | Ohio | 61,046 |
| 17 | Massachusetts | 55,448 |
| 18 | Louisiana | 52,137 |
| 19 | Missouri | 49,402 |
| 20 | Minnesota | 47,134 |
| 21 | South Carolina | 46,747 |
| 22 | Oregon | 45,102 |
| 23 | Indiana | 43,777 |
| 24 | Arizona | 42,909 |
| 25 | Wisconsin | 38,002 |
Nobody knew what would trigger the next financial crisis, but just about everyone knew it would involve the record pile of corporate debt. And so it happened. Now the Fed fixed it.
Source: https://wolfstreet.com

Your Tax Free Donations Are Appreciated and Help Fund our Volunteer Website
Disclaimer: We at Prepare for Change (PFC) bring you information that is not offered by the mainstream news, and therefore may seem controversial. The opinions, views, statements, and/or information we present are not necessarily promoted, endorsed, espoused, or agreed to by Prepare for Change, its leadership Council, members, those who work with PFC, or those who read its content. However, they are hopefully provocative. Please use discernment! Use logical thinking, your own intuition and your own connection with Source, Spirit and Natural Laws to help you determine what is true and what is not. By sharing information and seeding dialogue, it is our goal to raise consciousness and awareness of higher truths to free us from enslavement of the matrix in this material realm.


")


")


