 EN
EN FR
FRWe’re not even thinking about thinking about” slowing the decline of the dollar’s purchasing power — and thereby labor’s purchasing power.
By Wolf Richter,
A supply shock and a demand shock came together during the Pandemic, and it produced chaos in the pricing environment. There was a sudden collapse in demand in some segments of the economy – restaurants, gasoline, jet fuel, for example – and a surge in demand in other segments, such as eating at home, and anything to do with ecommerce, including transportation services focused on it.
These shifts came together with supply-chain interruptions and supply chains that were unprepared for the big shifts, leading to shortages in some parts of the economy – the supply shock. There were empty shelves in stores, while product was piling up with no buyers in other parts of the economy.
The sectors surrounding gasoline, jet fuel, and diesel fuel – oil and gas drilling, equipment manufacturers, transportation services, refineries, etc. – were thrown into turmoil as demand vanished, leading to a total collapse in energy prices. In April, in a bizarre moment in the history of the oil business, the price of the US benchmark crude WTI collapsed to negative -$37 a barrel.
Since then, the price of crude oil has risen sharply (now at positive +$41 a barrel), as demand for gasoline has returned to near-normal while demand for jet fuel remains in collapse-mode, as people are driving to go on vacations, instead of flying, and as business travel is essentially shut down.
As a result, for a few months, all of the inflation data was going haywire, with some prices plunging and others spiking. This is now being worked out of the system.
Energy prices are way up from March and April, but remain below last year. Gasoline prices jumped by 12.6% in June from May and by another 5.6% in July from June, but are still down 20.2% from July last year, according to the Consumer Price Index report this morning by the Bureau of Labor Statistics. Electricity services rose 0.3% in July, after a sharp decline in the prior two months.
Prices of food eaten at home, after surging March through June during the shifts and the era of empty shelves, backtracked in July by 1.1% from June, but were still up 4.6% from last year. More on the major categories in a moment.
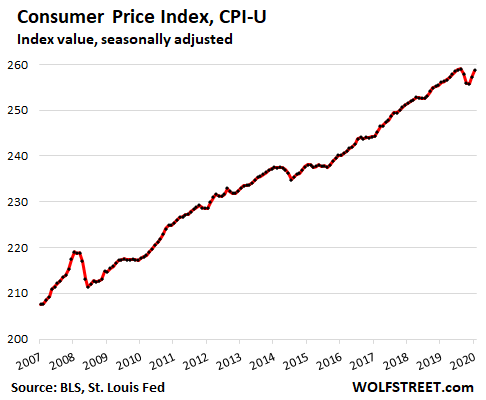
Overall inflation as measured by the Consumer Price Index for urban consumers (CPI-U) jumped 0.6% in July from June, after having jumped 0.6% in June from May, wiping out the declines in March through May. Compared to July 2019, CPI was up 1.0%, still held back by the 20.2% year-over-year decline in energy prices. The June and July month-to-month increases of 0.6% each were the largest two since 2009.
The CPI without food and energy also rose 0.6% in July from June and was up 1.6% from July last year.
When we say that the CPI in July rose 0.6% from June, we mean that it rose from an index value of 257.2 to an index value of 258.7. We get this chart that looks like progress, like something good has been happening, with a fairly consistent uptrend from the bottom left to the right top, sort of like a stock market chart, and the Fed and economists want this line, and lines of other inflation indices, to move up at a steeper angle, and they then take great pride in it when it does:
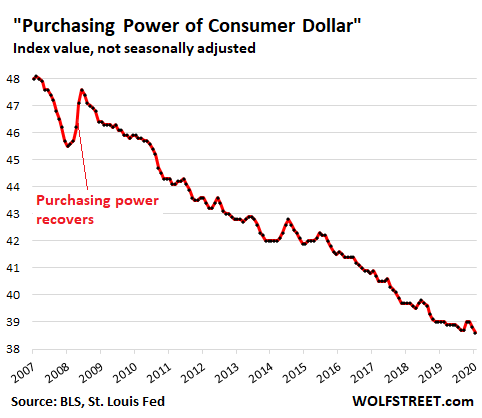
But the Bureau of Labor Statistics also offers the corollary index, the “Purchasing Power of the Consumer Dollar.” And it just hit a new all-time ever low. Note the purchasing power recovery during the Financial Crisis, when consumers could actually buy a little more with their labor for a few quarters:

When the Fed wants to increase consumer price inflation, it in effect wants to decrease the purchasing power of the consumer dollar.
Currently, the Fed is very impatient about chopping down the purchasing power of the dollar. To communicate this, Fed Chair Jerome Powell keeps repeating so eloquently that the Fed isn’t “even thinking about thinking about” containing the decline of the dollar’s purchasing power when it speeds up.
A decline in the purchasing power of the consumer dollar means a decline in the purchasing power of labor. And consumers (who are in their real life workers) need a corresponding increase in wage inflation.
For employers that are able to raise prices, but don’t have to raise wages, it means “cheaper labor” – and for decades this has now been one of the big issues in the US economy among the lower 40% of workers who provide this cheaper labor.
So for consumers who make their living by working, consumer price inflation means the purchasing power of their labor gets whittled down. Goods and services are more difficult to pay for, and their paycheck gets eaten up by rising costs, and there is less money left over to make mortgage payments and other debt payments.
Consumer price inflation, given the multi-decade wage environment, means the further impoverishment of the people in the lower income categories, and means making debt payments harder – not easier.
These people want wage inflation (getting paid more for the same work) to compensate them for price inflation, but wage inflation is anathema to Corporate America and the Fed.
Rising prices make debt payments easier only for those who can raise prices: Businesses, particularly Corporate America where pricing power and debts are concentrated.
Inflation by category.
Here are the changes of the Consumer Price Index for the major categories. The second column shows the relative weight of the line item in the overall CPI. The biggie is “services less energy services” which weighs 59.6% in the index. It includes two sub-biggies: “shelter” which includes rent and owner’s equivalent of rent, which account for one-third of CPI, and “medical care services,” with a relative importance of 7.4% in CPI.
The third column shows the change in prices in July compared to July last year. The three columns on the right show month-to-month price changes, with the sixth column showing the current change in July from June (if your smartphone clips the right part of the table and you don’t see six columns, turn your device in landscape position):
| Expenditure category | % weight | % YOY July | % Apr-May | % May-Jun | % Jun-Jul |
| Food | 14.3 | 4.1 | 0.7 | 0.6 | -0.4 |
| Food at home | 8.0 | 4.6 | 1.0 | 0.7 | -1.1 |
| Cereals and bakery products | 1.0 | 2.8 | -0.2 | 0.4 | -0.4 |
| Meats, poultry, fish, eggs | 1.9 | 8.4 | 3.7 | 2.0 | -3.8 |
| Dairy and related products | 0.8 | 4.4 | 1.0 | -0.4 | -0.8 |
| Fruits and vegetables | 1.4 | 2.3 | 0.5 | 0.4 | 0.1 |
| Nonalcoholic beverages | 0.9 | 5.0 | 0.0 | 0.7 | -0.5 |
| Other food at home | 2.0 | 3.9 | 0.0 | 0.2 | -0.2 |
| Food away from home | 6.3 | 3.4 | 0.4 | 0.5 | 0.5 |
| Energy | 6.1 | -11.2 | -1.8 | 5.1 | 2.5 |
| Energy commodities | 2.9 | -20.2 | -3.5 | 11.7 | 5.3 |
| Fuel oil | 0.1 | -27.2 | -6.3 | 10.2 | 4.3 |
| Motor fuel | 2.8 | -20.3 | -3.5 | 12.0 | 5.5 |
| Gasoline (all types) | 2.7 | -20.3 | -3.5 | 12.3 | 5.6 |
| Energy services | 3.2 | -0.1 | -0.5 | -0.2 | 0.0 |
| Electricity | 2.5 | -0.1 | -0.8 | -0.3 | 0.3 |
| Utility (piped) gas service | 0.7 | -0.3 | 0.8 | 0.0 | -1.0 |
| Other goods | 20.7 | -0.5 | -0.2 | 0.2 | 0.7 |
| Apparel | 2.7 | -6.5 | -2.3 | 1.7 | 1.1 |
| New vehicles | 3.7 | 0.5 | 0.3 | 0.0 | 0.8 |
| Used cars and trucks | 2.5 | -0.9 | -0.4 | -1.2 | 2.3 |
| Medical care commodities | 1.6 | 1.1 | 0.1 | 0.2 | 0.0 |
| Alcoholic beverages | 1.0 | 1.5 | 0.8 | 0.2 | -0.3 |
| Tobacco and smoking products | 0.6 | 5.2 | -0.2 | 1.1 | 0.8 |
| Services less energy services | 59.6 | 2.3 | 0.0 | 0.3 | 0.6 |
| Shelter (rent & owner’s equivalent of rent) | 33.5 | 2.3 | 0.2 | 0.1 | 0.2 |
| Medical care services | 7.4 | 5.9 | 0.6 | 0.5 | 0.5 |
| Transportation services | 5.0 | -3.7 | -3.6 | 2.1 | 3.6 |
| Motor vehicle maintenance and repair | 1.1 | 3.5 | 0.4 | 0.1 | -0.1 |
| Motor vehicle insurance | 1.5 | -1.9 | -8.9 | 5.1 | 9.3 |
| Airline fares | 0.6 | -23.7 | -4.9 | 2.6 | 5.4 |
Source: https://wolfstreet.com

Your Tax Free Donations Are Appreciated and Help Fund our Volunteer Website
Disclaimer: We at Prepare for Change (PFC) bring you information that is not offered by the mainstream news, and therefore may seem controversial. The opinions, views, statements, and/or information we present are not necessarily promoted, endorsed, espoused, or agreed to by Prepare for Change, its leadership Council, members, those who work with PFC, or those who read its content. However, they are hopefully provocative. Please use discernment! Use logical thinking, your own intuition and your own connection with Source, Spirit and Natural Laws to help you determine what is true and what is not. By sharing information and seeding dialogue, it is our goal to raise consciousness and awareness of higher truths to free us from enslavement of the matrix in this material realm.


Gold is Rising in value after being suppressed in order to boost the petro dollar since its inception.
There is a reason for this.
Look at Judy Shelton
Look at the economy
Look, its kinda obvious what occurring.
Get ready