 EN
EN FR
FRBy Chris Hamilton,
Soaring Debt Vs. Shrinking Populations Of Young To Repay Or Service That Debt
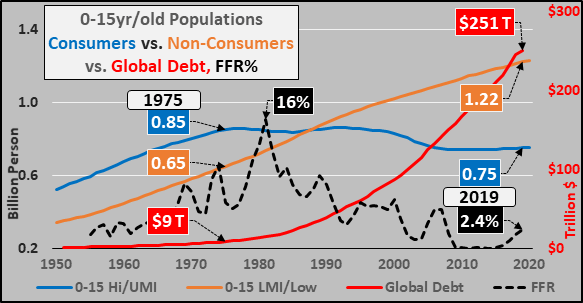
Global debt is currently at $246.5 trillion and primarily in the Wealthier, Consumer Nations of the world.
The population of young in Consumer Nations has fallen 12% or over 100 million Since Peaking in 1975.
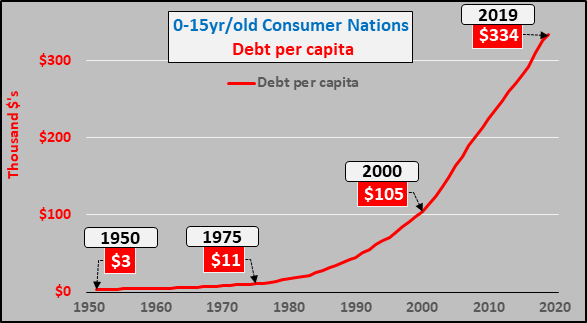
Debt on a per capita basis gauged against the consumer nations young is going parabolic.
For nearly a half century wealthy nations young populations have been declining versus rising young among poor nations…offset by secularly declining interest rates and the addition of over $240 trillion in global debt to maintain unnaturally high rates of economic growth. The consumer nations population of relatively wealthy young has been declining for nearly 4 and a half decades, falling over 100 million or 12% during that span. The population of relatively poorer nations young has increased by nearly 190% or increased by 570 million. On average, each wealthier nations young person represents $26.5k in per capita consumption versus each poor nations young represents $1.5k in per capita consumption.
Said otherwise, it takes 15 more poor nations inhabitants to replace the loss of every one wealthier nations inhabitant to simply maintain flat consumption, thus the impetus for interest rate cuts and massive increases in debt among the wealthy. Obviously, consumption hasn’t been flat but has grown tremendously, primarily thanks to interest rate cuts, cheap debt, and only in a very small part from growth in consumption among the poorer nations population gains.
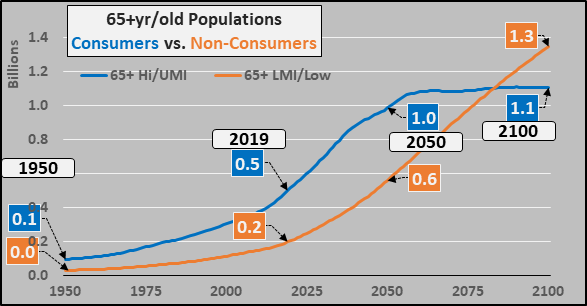
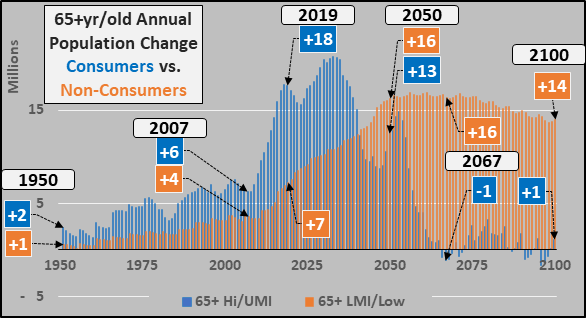
As I started in my last article, the world is characterized by stark inequalities among the global nations of “haves” and “have-nots”. The World Bank is kind enough to categorize the world’s nations into four buckets by the Atlas Gross National Income per capita (geographically detailed HERE and listed HERE). High income nations range from $84k to $12k per capita, Upper Middle income nations $12k-$4k per capita, Lower Middle income nations $4k to $1k, and Low income nations less than $1k per capita. To simplify what is taking place, I sweep the high and upper middle income nations 0-15yr/old populations together (blue line below), as these nations represent 90% of the global income, savings, and access to credit. They consume 90% of the global energy and purchase 90% of the global exports. They drive global economic activity. Likewise, I sweep the have-nots 0-15yr/old populations together (tan line, below). To view the full picture, I include global debt (red line) and the Federal Funds rate (black dashed line).
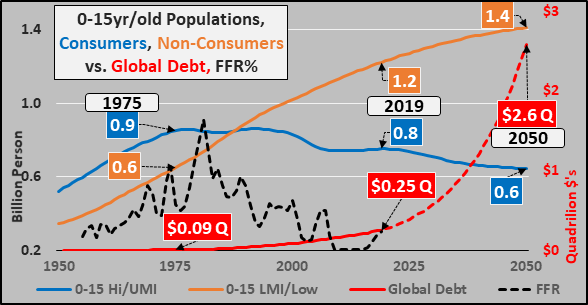
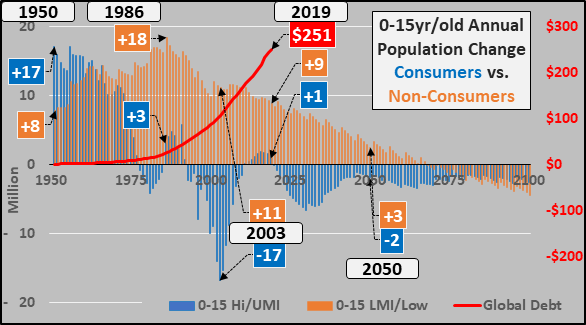
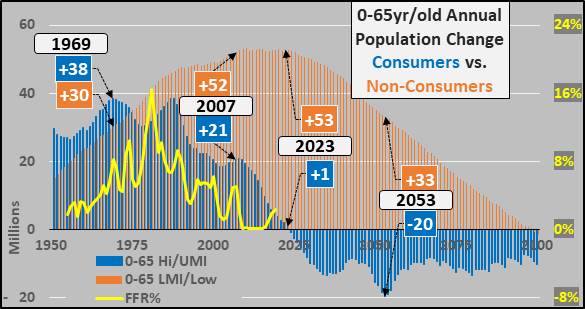
Again, the growth in potential consumption among the far poorer populations in no way offsets the declining potential of consumption among the declining wealthier populations…without ZIRP (or more likely NIRP) and debt of gargantuan proportions.
Source: Econimica blog,

Your Tax Free Donations Are Appreciated and Help Fund our Volunteer Website
Disclaimer: We at Prepare for Change (PFC) bring you information that is not offered by the mainstream news, and therefore may seem controversial. The opinions, views, statements, and/or information we present are not necessarily promoted, endorsed, espoused, or agreed to by Prepare for Change, its leadership Council, members, those who work with PFC, or those who read its content. However, they are hopefully provocative. Please use discernment! Use logical thinking, your own intuition and your own connection with Source, Spirit and Natural Laws to help you determine what is true and what is not. By sharing information and seeding dialogue, it is our goal to raise consciousness and awareness of higher truths to free us from enslavement of the matrix in this material realm.


