By David Haggith,
I’m not going to predict when and how the US stock market will crash as I did by laying out the stages of its fall for 2018. That was easy, but the times are different now.
Back then, the Fed had laid out a precise schedule for its tightening, and it was apparent to me where the big increases in Fed tightening would be sufficient to bring down the market that the Fed had artificially rigged.
Today, the Fed is back to easing — back to doing what it does to juice markets up. And the correspondence between what central banks do with their balance sheets and what the stock markets do is now almost 100%.
All of 2019 looks like lockstepping to me.
The Fed, of course, is the primary mover for the US market. Therefore, US stocks being overpriced in the extreme may not matter so long as the Fed is willing to keep the money pumps redlining at maximum RPM.
However, the more the market’s metrics move above all rational and historic benchmarks, as I’ll show they now have, the greater its fall will be if the Fed pulls the plug, AND the more sensitive it will become to the Fed even wiggling the plug. So, the situation is, in that sense, more perilous than at anytime past because some of the market’s most fundamental valuation metrics are now printing at levels never seen before.
Let me lay that out for you.
Market madness still being Fed
As I will lay out in my next Patron Post, the Fed has given some indication of a mild return to tightening in the near future, and that could create problems for the market. The Fed has not, however, laid out any clear schedule for tightening, and it won’t get far down that road before it sees market problems, and goes right back to easing because we are now in QE4ever by which I really mean “QE4ever or die!”
That is because, as soon as the Fed backs away from QE, it will see its dependent child go into paroxysms, and like any parent who knows he or she has a sickly child that is highly dependent on continued life support, the Fed will rush back to supporting its baby — the stock market.
Outside of Fed help, the case to be made against the market is huge — as big as it was before the last two major recessions. The market today looks in almost every way like it did just before the dot-com bust, but the difference, then too, was that the Fed started tightening back then. Therefore, as long as the Fed continues its present path of easing, there may not be anything like the dot-com bust, barring a deep recession that busts everything; but the Fed is now the only thing between the market and a bust.
Here are the similarities that scream market melt-up:
The market is overvalued and melting up
How high is it?
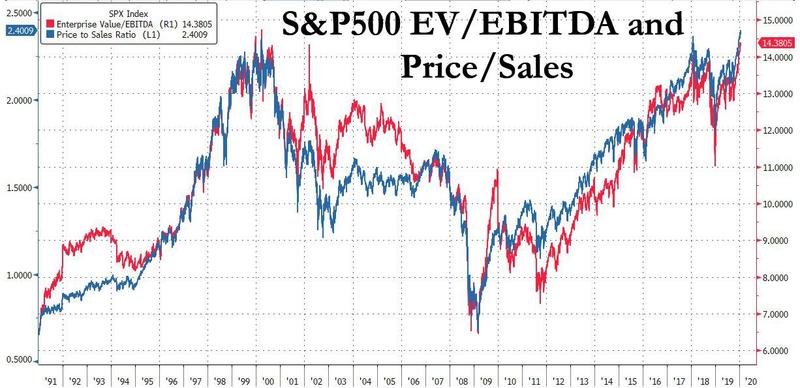
The market is a stoner. As a ratio comparing stock prices to either earnings or sales (two historic benchmarks for assessing how pricy stocks are), the price of stocks is higher right now than it has ever been in history. This market is tripping on some pricy hallucinogens.
(EV/EBITDA compares an enterprise’s value to its actual earnings before interest, tax, depreciation, and amortization. Typically a value below 10 is considered healthy.)
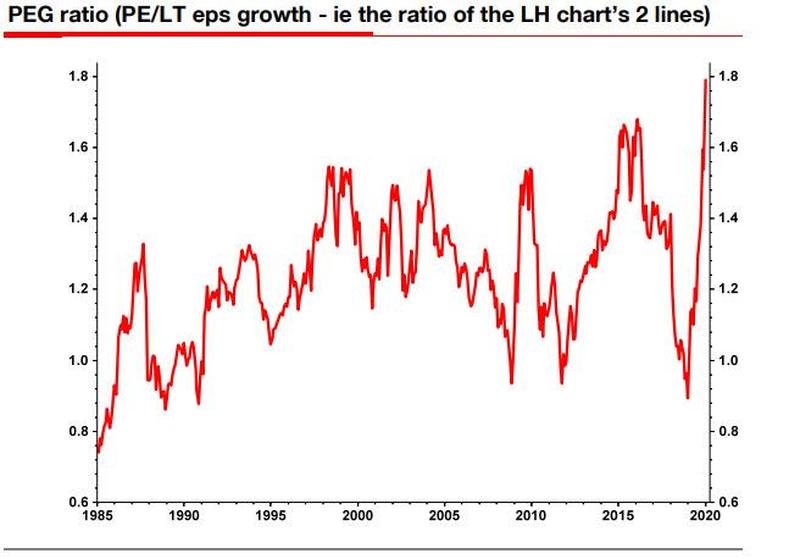
The PEG is another measure that looks looks for overvaluation by comparing the Price/earnings ratios of stocks to their long-term expected growth in earnings. It, too, has soared in the past quarter to reach an all-time high:
Prices are more overvalued based on these historic metrics than they were before the financial crisis that caused the Great Recession and even in the stratospheric run-up to the dot-com bust. We have never — ever — been priced this high! That means fundamentals have further to go to catch up to current valuations than at any time in history.
Investors should keep in mind that market valuations stand nearly three times the historically run-of-the-mill valuation levels from which stocks have historically generated run-of-the-mill long-term returns. In fact, the highest level of valuation ever observed at the end of any market cycle in history was in October 2002, and even that level is less than half of present valuation extremes.
So how do you get to historically run-of-the-mill valuation norms? The answer is simple: Wait nearly 30 years, allowing both the U.S. economy and U.S. corporate revenues to grow at the same rate as the past two decades, while stock prices remain unchanged, with no intervening periods of recession or investor risk-aversion, or alternatively (and far more likely), watch the S&P 500 lose two-thirds of its value over the completion of this market cycle.
My view is that the first 30% market loss from recent highs will be the beginning, not the end of the bear market ahead…. To be clear, a two-thirds market decline would not even drive the most historically reliable valuation measures below their historical norms.
John Hussman, president of the Hussman Investment Trust, in his latest note to investors
So, what is going to drive stock values up even further … other than the one thing that has been driving them for the past decade to the present perilously overvalued height — the Fed? If you know what the Fed is going to do, you might be able to make a safe market bet; but just recognize that your hope for making money in stocks hangs entirely upon your being right about what the Fed will do in the months ahead.
As for any hope of those fundamentals catching up, three quarters of CFOs polled in the US say the market is greatly overvalued. That will not, of course, prevent them from overvaluing it more with more stock buybacks … financed in good part by the Fed’s easy money.
Chief financial officers at big U.S. companies entered 2020 on a cautious note, with almost all anticipating an economic slowdown against the backdrop of an overvalued stock market, according to a survey released Thursday…. 82% anticipate taking more defensive actions, like reducing discretionary spending and headcount, as a way to stave off the looming headwinds.
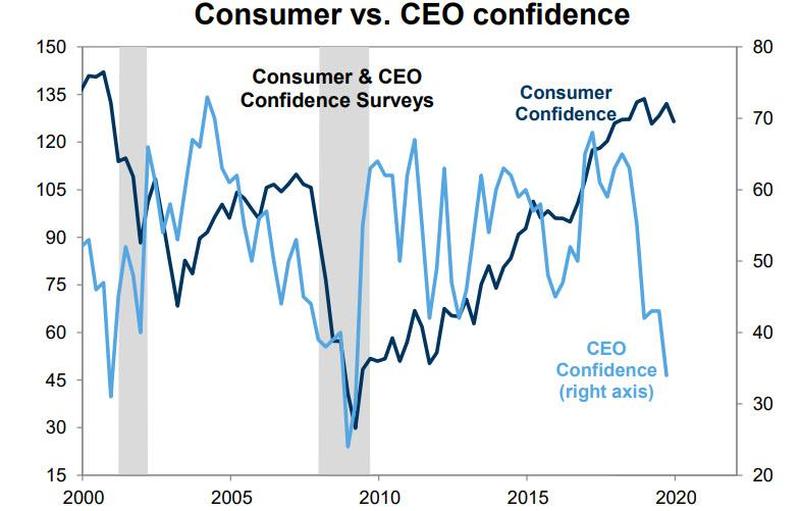
CEO confidence doesn’t look any better and disagrees in the extreme with consumer confidence:
So, the biggest insiders (CEOs and CFOs) are united in their belief that the market is priced to perfection with a business future immediately ahead that looks far from perfect. Yet, the market is rising at a rate that can only be matched by previous melt-ups.
“At this level, many things have to go optimally so that the prices are higher at the end of the year,” comments David Rosenberg on the growing complacency among investors. The renowned economist and strategist is one of the most profound experts on the U.S. economy and one of the last remaining skeptics to warn of a correction.
His bearish view is based on exorbitantly high equity valuations and over-optimistic earnings expectations. He also thinks that the US consumer sector is in worse shape than the consensus believes….
This is a liquidity and momentum driven market. It’s been that way for the past four months where the correlation between the S&P 500 and the Fed’s balance sheet has expanded to a 95% relationship. This is a case of a very accommodative Fed policy. The double-digit growth in the money supply is bypassing the real economy and has entered into asset markets broadly, and specifically into equities. So as long as the Fed is in the game priming the monetary pump, shorting stocks is going to be a very dangerous game to play … but this overall market rally is more a house of straw than a house of brick….
People will claim that there is no recession. Statistically speaking that’s true as far as GDP is concerned. But we know for a fact that we actually had a four-quarter earnings recession. I never quite understood why GDP is so important to an equity investor who is buying an earnings stream. There’s no ticker “GDP” on the New York Stock Exchange. So it’s not about the overall level of GDP, it’s really about earnings and about the fact that if you look at the 30% share of the U.S. economy that is outside of the consumer space, we actually have been in a recession in the past two quarters.…
[Does that sound like anything predicted here for 2019?]
On a median basis, the U.S. economy has stopped growing three quarters ago. Also, the U.S. consumer is not as nearly in good shape as people think. We see signs that the labor market is starting to show some fatigue….
The Fed would not be cutting interest rates three times and then re-extending its balance sheet at a rate that even exceeds what they were doing with QE3. The most important correlation to the stock market today is the Fed’s balance sheet. The power of the Fed has become so acute that it has replaced the economy as a principle influence over the stock market to the point where there is only a 7% correlation between GDP and the S&P 500. Historically, in any given cycle that relationship was anywhere between 30% and 70%. The amount of easing that the Fed has done since the beginning of October by expanding the balance sheet is just about as strong in terms of basis points as the three rate cuts they engineered last year. They have cut rates almost a 150 basis points when you look at it on an equivalent basis.
Rosenberg points out an interesting corollary between the Fed’s recent emergency liquidity explosion and the main event that triggered the dot-com bust in 2000:
We have a template of what happened when the Fed provided a lot of liquidity juice to the marketplace with the Y2K special lending facilities in late 1999. At that time, the market strongly surged, and kept on rallying into the early part of 2000. Then, the Fed started to withdraw that liquidity and it wasn’t a pretty picture.
So, here we are in the early part of 2020 with the market strongly surging due to the Fed having juiced the marketplace with “a lot of liquidity” for the year change in late 2019, exactly as it did in 1999 for the Y2K year change, and again the Fed is, at least, talking about starting to draw down liquidity in April or perhaps before as it did shortly after the Y2K year change.
Will this time also end as “not a pretty picture.”
In 2018 it was easy to know when the market would go into paroxysms because the Fed had published a set schedule for its tightening. This time, as Rosenberg says,…
It’s tough to time when the Fed is finally going to sit back and say: “Ok, you know what: I’m not handing any more candy to the kindergarten class”. My sense is that the response to the Fed no longer priming the pump could be significant.
We’re now “all in”
Don’t let marketeers influence you with their claims that the market is going to rise this year. You can bet that every single one of them, if alive in 2000, was saying the same thing then, too. Though some feared the ridiculous heights the market hit in 2000, almost no one was calling for it to crash.
As Mark Hulbert, who has been in this game for a long time, recalls,
On Jan. 14, 2000, the Dow DJIA … hit its bull-market high prior to the bursting of the internet bubble. And, yet, you’d have never known it by reading what the newsletter editors then were saying. In fact, after reading through my newsletter archives from January 2000, I was struck by the similarities between now and then.
2008 went the same way. Anyone remember Goldman’s investment advice to its clients just before the 2008 financial crisis implosion? Everything it wrote was printed in vampire squid ink:
The first thing you need to know about Goldman Sachs is that it’s everywhere. The world’s most powerful investment bank is a great vampire squid wrapped around the face of humanity, relentlessly jamming its blood funnel into anything that smells like money. In fact, the history of the recent financial crisis, which doubles as a history of the rapid decline and fall of the suddenly swindled dry American empire, reads like a Who’s Who of Goldman Sachs graduates.
While it sucked everyone dry, it outwardly recommended buying more stocks that would fail, even as it bought up lots of almost everything that would do well when other things crash.
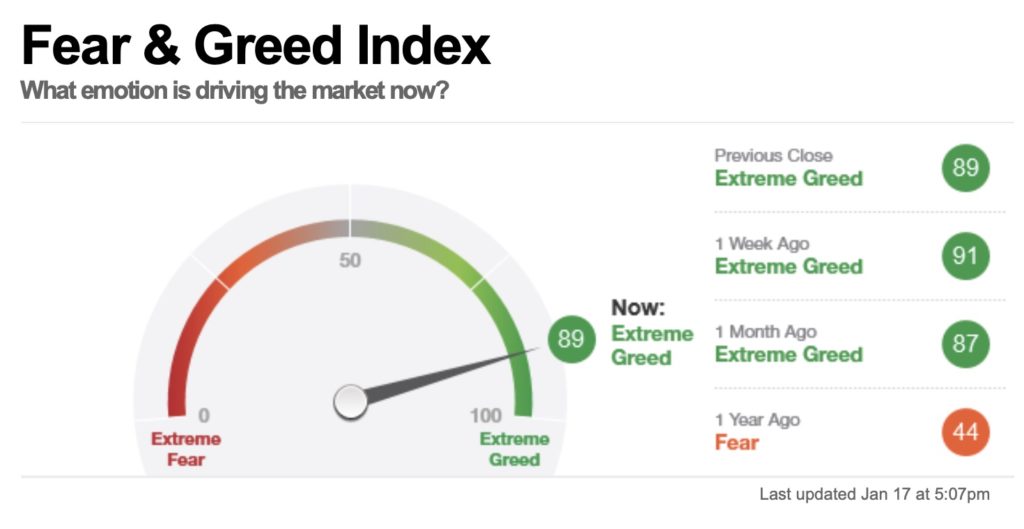
One strong sign of a melt-up and the nearing top of a market is when everyone is in — retail investors like mom and pop and the big money or “smart money” like institutional funds. When there is not a lot of money sitting on the sides, only newly created money can push the market up. When everyone is in, enthusiasm (or euphoria) is at its peak.
Beware those who have stocks to sell. All the big advisors counsel everyone to jump in when MOMO and FOMO hit their peaks. How else will they get rid of all their own holdings so close to the peak? According to Rolling Stone and many other publications, that’s what Goldman did to maintain its Sachs of gold. That’s how it got the name “Vampire Squid.”
We’re now “all in”:
Contrary to several goalseeked indicators which erroneously repeat week after week that whales and other prominent institutional traders remain “on the fence” despite the now daily record highs in the S&P, the truth is that virtually everyone is now all in: from simple human-driven discretionary, to macro funds, all the way to algo and CTAs…. “Equity positioning … has run far ahead of current growth as investors price in a global growth rebound….” The question is, are people starting to feel more upbeat about the global economy or is this just another round of central bank dovishness designed to propel asset prices higher? The answer appears to be, yes. Weakness will be met with overt accommodation. Strength with silence.
Or is just another round of Goldman, which populates all levels of the Fed with former GS people and others that it recommends, fleecing the flock? (As a refresher, read the whole Rolling Stone article quoted above, written at the end of those desperate times.)
Money-losing companies are shoving market valuations to the summit
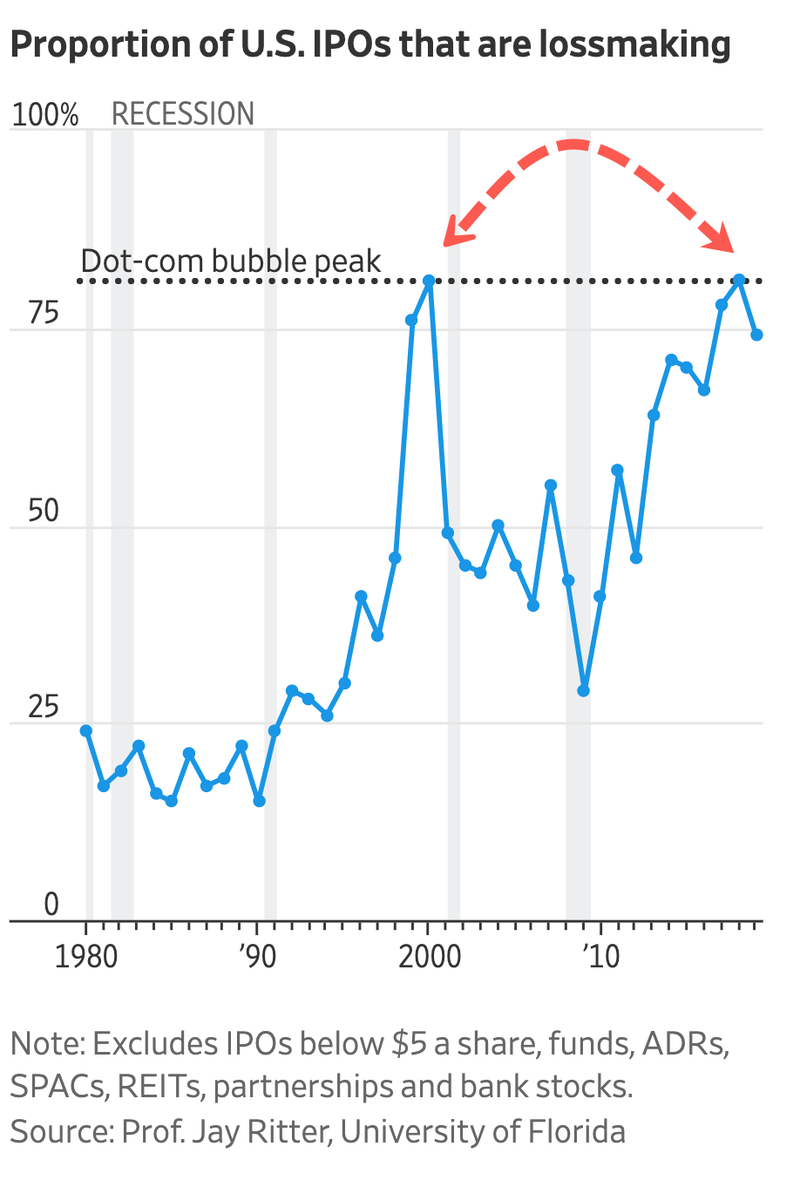
One of the big concerns during the final year or two of the market’s rise before the big dot-com bust of 2000-2002 was that so many companies that never made a dime were leading the market into the stratosphere. We’re pretty well back to that.
Tesla Inc. shares have doubled in three months, while General Electric Co. shares are up 44%. The pair are the two most valuable loss-making companies, part of a shockingly high proportion of listed companies that have been losing money—despite, or perhaps because of, the long bull market.
The Journal says these two are two very different exemplars of profitless companies in today’s stock market. Tesla has never made a dime, and is now one of the most highly valued companies in the market, and GE is a megalithic dinosaur of great value in the past that has been losing money for years.
The Journal article says that 40% of listed companies in the U.S. are currently losing money quarter after quarter. The biggest area of massive-money-losers in the dot-com gold-rush was the IPO segment of the market. The same is true today:
Maybe it would be good to reflect on what took the market leaders (the “Nifty Fifty”) higher and higher in the prelude to the dot-com bust:
The Nifty Fifty appeared to rise up from the ocean; it was as though all of the U.S. but Nebraska had sunk into the sea. The two-tier market really consisted of one tier and a lot of rubble down below. What held the Nifty Fifty up? The same thing that held up tulip-bulb prices long ago in Holland – popular delusions and the madness of crowds. The delusion was that these companies were so good that it didn’t matter what you paid for them; their inexorable growth would bail you out.
Forbes Magazine, 1977, The Nifty Fifty Revisited
Bonds overflowing
While stocks are overflowing, so is the pouring of money into safe-haven bonds. If the current net flow of money into bonds were to continue all year, it would look like this compared to any other year since the Great Recession began:
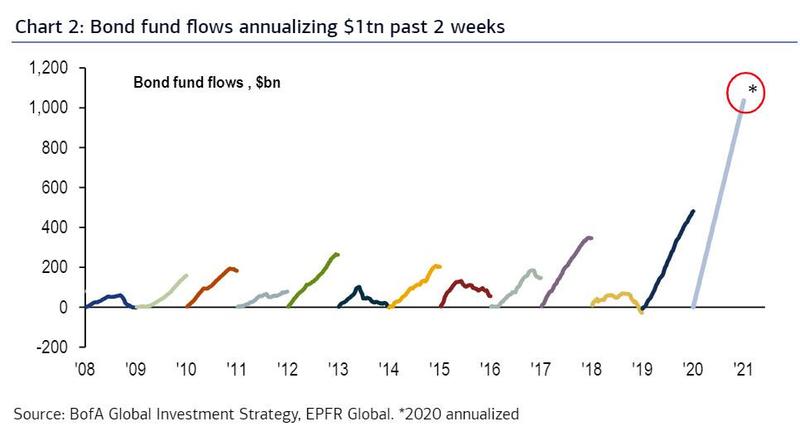
Of course, the flow of money into bonds probably will not continue at that rate all year, although several years shown above did continue at the same rate most or all of the year. Still, many others did not and even turned downward partway through the year. Regardless, the steepness of the rise in the first two weeks of January exceeds that seen at the start of any year on the chart, except maybe 2015.
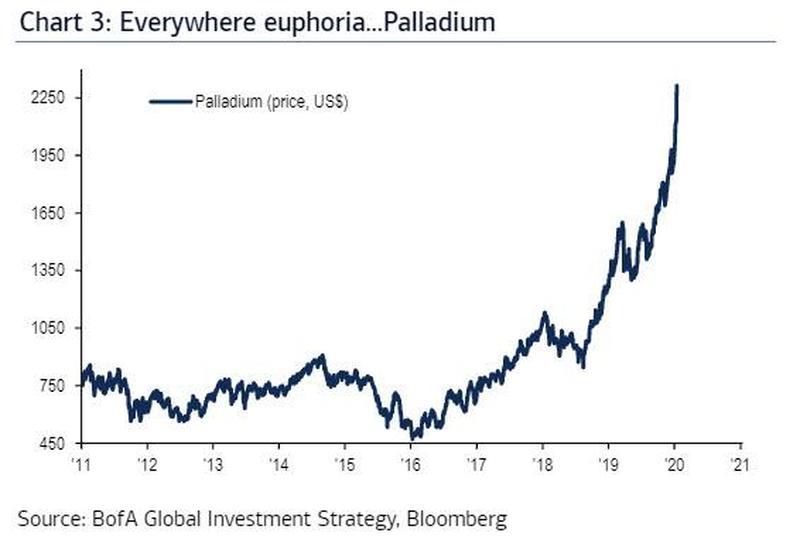
Bonds aren’t the only safe havens rising as a warning sign alongside soaring stocks. Precious metals are, too:
David Rosenberg notes why he believes gold is on the rise and should be:
When you compare the new supply of gold against the supply of money coming into the system from Central Banks, to me it’s a very clear cut case that you want to have very high exposure to bullion….
Gold demand is predicated on the final act which is going to be right-out debt monetization. When we get to the lows of the next recession, we’re going to find that these Central Banks that already have been extremely aggressive are going to engage in what is otherwise known as the “debt jubilee” or a right-out debt monetization which was actually the final chapter of the Bernanke playbook. Remember, Ben Bernanke got his nickname “Helicopter Ben” because in a speech in 2002 he suggested that helicopter money could always be used to prevent deflation. So we’re going to have helicopter money.
Buyback bonanza is slowing down
It’s no secret that the Fed’s new money and low interest, and the US government’s one-time allowance for low taxes on the repatriation of overseas cash hoards has fueled the market higher.
Over a trillion dollars has been spent on stock buybacks by twenty companies over the past five years to push up the values of the markets leaders. What happens when those companies have used up all the foreign profits they had to repatriate or when interest rises so debt to fund buybacks is not longer cheap or when those “trillion-dollar babies” just reach the maximum amount of debt they feel comfortable taking on … or reach the maximum amount for which ratings agencies feel comfortable selling good ratings?
Currently buybacks are slowing down due to the fourth-quarter reporting period. Repatriation money is also likely running out for many companies, because it has been two years since cheap repatriation of former foreign profits was allowed under the revised tax code as part of the Trump Tax Cuts.
It feels like 2018 all over again
I still think, as I wrote in December, that the following is a strong contender to become the market’s peak before it hits a wall:
The market has a highly attractive 30,000-foot altitude marker in the sky to hit on the Dow. That attractive goal will tend to suck the market quickly up another 5% until it nears that target.
Once the market gets to that target, however, that number tends to become resistance as everyone starts to wonder if it can break it and if it will hold or crash in fear of such great heights. 30,000 is a much stronger number psychologically than 29,000 was because it breaks into a new 10,000-foot level. The human psyche likes big, fat, round numbers like that.
Once it gets to that level, however, it can generate a lot of fear because of how perilously high the market suddenly feels, which makes it an ideal number for an ultimate blow-off top
I’m not predicting 30,000 is the major breaking point. I’m just noting that I think it is a strong psychological milestone that is quite near in the present melt-up stage as both the brass ring for investors to reach for and then perhaps to fade … or even flee if people see a lot of fading happening. It will deepened onhow many other things are going bad at the same time or on one thing going bad — Fed support. (Don’t say it can’t happen. It did in 2018 when the Fed should have known better then, too.)
First, let me point the last time we neared a milestone of this kind (Dow 20,000). You can see in the graph below that it was both a magnet, sucking stocks upward and then a two-month bench to rest on. However, the steep final rise to that level was not a melt-up because a “melt-up” is meant to imply things are about to melt down:
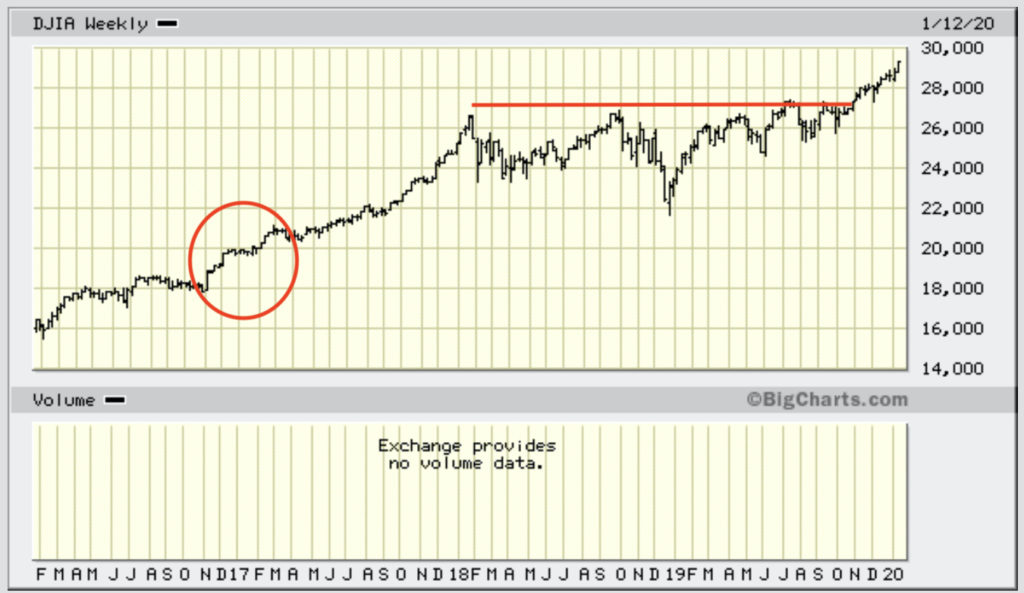
30,000 will be a natural place to catch one’s breath, but what happens at that point will depend a lot on what kinds of events happen when the market takes a pause bringing momentum to a halt — say if buybacks fade for the reasons above or if earnings estimates sink more than expected or a very low GDP print; BUT it relies far more than anything on whether the Fed fades its current easing.
After December, I got out of stocks to sit this mile-marker and possible Fed transition point out. (I don’t even like being in stocks now, given how insane the market is; but my predictions of the market’s fall were based on Fed tightening, so a return to easing changed things for the last few month.)
As for what happens in a Fed tightening regime, the graph above also bears testimony to just how much the market changed in January of 2018 for the remainder of that year and how it remained below its January blow-off top with some hard bouncing even through the first three quarters of 2019 as the Fed’s quantitative tightening continued … even though the Fed stopped raising interest rates. Only when the Fed moved deep into QE4ever did the market finally sustain a rise above its two 2018 high mark.
As for what happened back then when the Fed tightened and how it compares to now,
Stock market investors could be setting themselves up for a nasty fall … according to Mark Newton, a popular independent market technician, in a Friday note to clients.
“US stocks have moved up at a clip that’s eerily reminiscent of January 2018,” he wrote. “No news really matters to shake markets, and bad economic news or earnings, not to mention geopolitical threats matter for a few hours only before the relentless rally continues unabated,” he wrote.”
The S&P 500 index … fell more than 10% between Jan. 26 of 2018 and Feb. 9 of that year, after rallying more than 27% between the start of 2017 and the Jan. 2018 top.
“Make no mistake, this market move is NOT normal, and is NOT something which should be able to continue technically into and through February without a major hiccup,” he added.
“Markets truly seem to be near exhaustion using traditional methods, but it’s proper to wait on the sidelines until the break gets underway, which should prove swift and severe….”
That said, it’s incredibly difficult to predict exactly when euphoric sentiment will take a turn for the worse. “Indicators don’t flash red when the market is at a top,” Newton warned. “It’s hard to go out there and really trumpet a big bearish call, which makes you wonder if its probably the right thing to be doing.”
BEAR in mind,
Most initial bear market declines are accompanied with versions of Herbert Hoover’s 1929 statement that “the fundamental business of the country is on a sound and prosperous basis.”
The only failsafe red indicator now that the market is ignoring all economic the metrics of all economic/business fundamentals is the light on the power cord to the Fed. Everything depends on the Fed and what it does, and right now the Fed is not all that clear about what it will do. It is certainly not clear that QE4ever will continue without a failed attempt at reversing it.
The big thing to use as your red light is any attempt or mention of an upcoming attempt by the Fed to prove it is not financializing the US debt by moving back toward tightening … or even just stopping the money pumps. (It, of course, won’t mention the “financializing” part, as it doesn’t want you to even think about that, but look for hints of tightening that it can use to support its argument that it is not monetizing the debt with anyone who calls it to task.)
Bear in mind the only way the Fed can maintain its lie that it is not illegally financing the national debt with QE4ever is if it can prove that its recent massive asset purchases were just temporary emergency monetary responses. Lack of “temporary” = QE4ever = the Fed monetizing the US debt by soaking up US treasuries forever … or until the Fed decides to crash the entire economy by tightening again. (It is only 4ever if the Fed wants the economy to keep going.)
So long as the Fed even shows it is going to do nothing more than hold its existing treasuries for years to come, it is, at least, guilty of monetizing that much of the US debt. Throughout QE, the Fed’s sole argument that it was not monetizing the debt rested on its QE being temporary.
The Fed has a great need to quit its repo recovery actions so that the Fed can prove it is not financing the US government by sopping up its debt to roll over in perpetuity. It doesn’t make any difference that the Fed is only buying short-term treasuries, as it now claims for its excuse, if it rolls those short-term treasuries over forever. That is just short-term dressing in name only on permanent monetization of the debt. So economists, analysts and politicians will be questioning the Fed’s “not QE” if they see that the Fed simply cannot stop. The Fed is fully aware of that. As I noted in last year’s early Patron Posts, the Fed expressed great concern about losing trust in 2018.
At the same time, this market has nothing left to keep it up but Fed fumes.
Source: http://thegreatrecession.info
Disclaimer: We at Prepare for Change (PFC) bring you information that is not offered by the mainstream news, and therefore may seem controversial. The opinions, views, statements, and/or information we present are not necessarily promoted, endorsed, espoused, or agreed to by Prepare for Change, its leadership Council, members, those who work with PFC, or those who read its content. However, they are hopefully provocative. Please use discernment! Use logical thinking, your own intuition and your own connection with Source, Spirit and Natural Laws to help you determine what is true and what is not. By sharing information and seeding dialogue, it is our goal to raise consciousness and awareness of higher truths to free us from enslavement of the matrix in this material realm.
 EN
EN FR
FR

