 EN
EN FR
FR
By Elaine Buxton
Editor’s Note: This is the first article of a 4-part series written by PFC member Elaine Buxton. Elaine has lived many years in California’s Central Valley and has first hand experience with water rights. Her investigation presents who controls water in the State of California, what authority has been granted to them, how they’ve mismanaged water rights and storage, and most importantly Buxton has tracked down where the water is – the reality is very different than the narrative pushed by mainstream media.
California is important to consider and inform people about because 1) California supplies 50% of food to the US and 2) what’s happening here is happening elsewhere as part of asset control by the cabal.
Introduction
In the midst of looming threats of food chain shortages following 20 years of severe drought in southern California, the CA governor and water authorities are presently in the process of enacting severe water restrictions for residents, businesses and farmers. With widespread recognition of the need to implement new water resource and ecosystem strategies, multiple solutions have been proposed, but often conflict with different stakeholder interests. This report will focus on the Los Angeles region in three parts. Part 1 describes the supply and demand gaps, water uses, water allocations and restrictions, water resources, and systems. Part 2 will summarize who the water controllers are and the not so pretty history of water grabs with the negative impacts on the ecosystems that lost their water resources. Part 3 will focus on scientific solutions for conservation, efficient use and equitable sharing of water resources
Although this series focuses on LA in southern California of the US, keep in mind that it can and does happen in other locations in the US and around the world. For example, the three reservoirs in Monterrey, Mexico have been drained, leaving poor residents with almost no running water in their homes. And in Europe, farmers are expected to cull 95 percent of their livestock, with near total destruction of national agriculture and repurposing of their land by the government for urban development.
Shortage and Water Rights Restrictions
According to the California Water Resilience Portfolio 2019, produced by the California Department of Water Resources (DWR), California’s usual pattern of precipitation ranges from 100 million acre-feet (MAF) in a dry year to over 250 MAF in a wet year, causing both droughts and floods with significant regional differences. About 60 percent of precipitation is lost to evaporation or used by natural vegetation such as forests and grasslands. Of the remaining water, a statewide average of 50 percent remains in rivers and flows to the ocean in north coastal regions. Almost no river water flows to the ocean or gulf in southern regions.
About two-thirds of water used by humans comes from surface water and the remaining water is pumped from underground aquifers. There are over 1,300 reservoirs in California for storage of surface water. However, diverting excessive water from rivers to the storage systems has degraded ecosystems and water quality. Groundwater is pumped from 515 groundwater basins across the state. Over-pumping has chronically damaged water tables and caused sinking of land in the Central Valley.
About 15 percent of the water supply for southern California cities comes from the Colorado River. Based on the arguments that water levels in Lake Mead and Lake Powell along the Colorado River are so low that they are nearing “dead pool status”, permanent climate change, and not enough water to go around, Governor Newsom declared on May 10, 2021 a drought emergency for 41 counties and outlined various actions that the State Water Board and other agencies should take or consider (www.waterboards.ca.gov/drought/delta). In June 2022, the US Bureau of Reclamation (USBR) demanded Colorado River Basin states to plan for and agree by August 2022, to an additional one to two-million acre-feet (MAF) reduction of water for the 2022-2023 year under the Tier 3 Drought Contingency Plan.
On June 27, 2022 the State Water Resources Control Board (SWRCB) issued the Revised Draft Emergency Regulation, which extended the 2021 Sacramento-San Joaquin Delta watershed and other river watershed curtailments, was formally adopted on July 20th. The Delta watershed constitutes California’s largest source of surface water, supplies a portion of water to 2/3 of Californians, irrigates million of acres of farmland, and is home to numerous fish, wildlife and vegetation. Residents were also asked to voluntarily reduce their water use by 15 percent over 2020 levels. As of June 27, 2022 over 170 household wells had already dried up in Fresno, Madera and Tulare counties (www.drought.ca.gov).
On June 10, 2022, the SWRCB enacted the Stage 2 Water Shortage Contingency Plan. According to the Metropolitan Water District of Southern California, all urban LA water users now must limit outdoor landscape watering to one day a week for 8 minutes, with a goal to slash water use by 35 percent. Tree watering, commercial nurseries, and golf courses are exempt. Washing cars at home is banned. Residents are questioning if big water users are also faced with the same pressures to conserve. For agriculture, water rights of 9,842 farms and irrigation districts across Sacramento and San Joaquin River watersheds have been stopped, representing more than half of the 16,700 existing rights. Rice farming in the Glenn-Colusa Irrigation and Browns Valley districts have been closed down as a result, devastating those communities. Primarily, only those with senior rights and a few districts with health and safety exemptions are now receiving water.
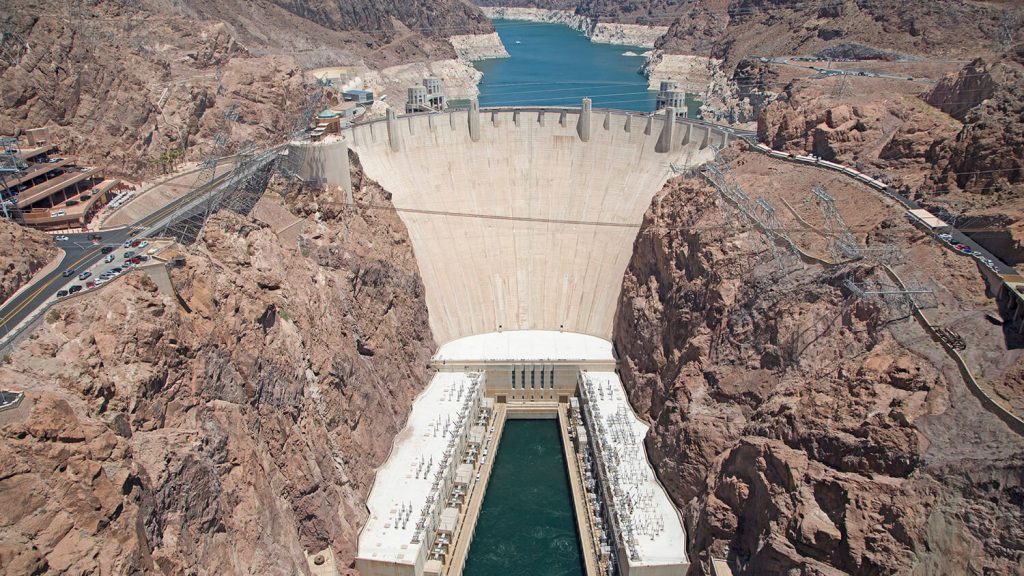
Reservoir levels in Lake Mead and Lake Powell along the Colorado River have been dropping significantly. Dead pool status is the point at which the dam’s turbines can no longer pump water. The dead pool level at Lake Mead is 895 ft and 3,523 ft at Lake Powell. Levels as of July 11, 2022 are 1,041’ and 3,539’, respectively. Lake Mead dropped over 43 feet from a level of 1085 feet in January 2021. Downstream water releases to Lake Mead and the Colorado River Lower Basin from Glen Canyon Dam at Lake Powell were reduced by the US Bureau of Reclamation (USBR) in May 2022 by nearly a half-million acre-feet on an annual basis. Lake Powell, however, will continue to receive 500K acre feet (AF) of water from the Flaming Gorge Reservoir located 455 miles upstream in the Green River watershed. That has raised the Lake Powell water level by 16 feet. Further north, Lake Shasta is at 39% capacity and Lake Oroville at 47% capacity. See Hoover Dam below:
Mainstream news has been sending out water and power shortage alarms this year, insisting that California residents begin to conserve more by another 20%. Complaints that residents are not doing enough voluntarily by the media ignores the LADWP report that south coast residents used an average of 66 gals per day as of May 2022, down from 91 gallons in 2021. Climate change with warming, prolonged drought, and critically low reservoir levels are the media and governmental justifications. Because the LA Basin only receives an average of 15 inches of rainfall annually, it depends on multiple sources of imported water for its 10 million residents. No mention is made of those other water resources and reserves, nor the impact on the need to grow food, care for wildlife in refuges or maintain the California economy. The new water potential from stormwater capture is rarely mentioned to the uninformed public either.
Water Use
Water in California is shared across three main sectors – environmental, agricultural, and urban/industrial – although the percentages vary dramatically across regions and between dry and wet years. And some of the water used by each sector returns to the rivers or groundwater basins where it is used again. As an example, runoff from agricultural irrigation often then supplies wildlife refuges and wetlands. Environmental water includes rivers and streams, wetlands within wildlife preserves, and water needed to maintain quality for agricultural and urban use. Any river water that reaches the ocean is along the state’s north coast that has less development or is protected for wild & scenic purposes. It’s rare for any Colorado River water to reach its terminus in Mexico’s Sea of Cortez in Baja, causing severe degradation of its delta due to salinity from low water flow.
Statewide averages for total freshwater use are 50 % for the environmental sector, 40 percent for agriculture, and the remaining 10 % for urban residential and industrial uses. Those statewide percentages change to 28%, 80%, and 10% respectively for developed freshwater use. More than nine million acres of farmland in CA are irrigated, out of the 43 million acres used for agriculture. Of this, 16 million acres are grazing land and 27 million acres are cropland.
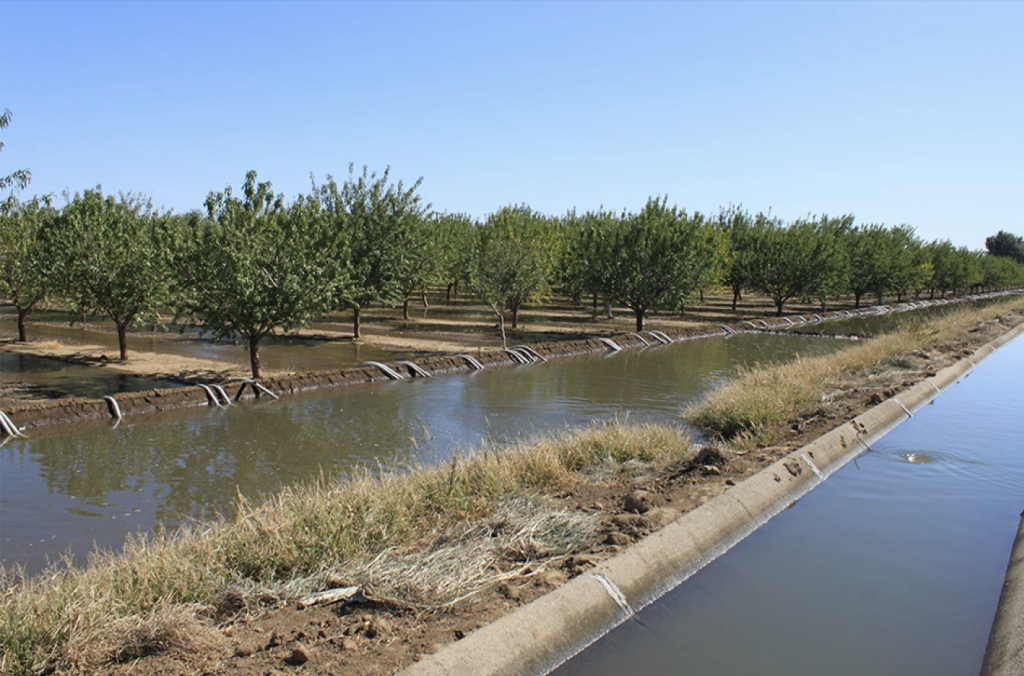
Farmers and ranchers use about 30 MAF of water annually (Water Resilience Portfolio, 2019). High revenue crops, such as nuts, grapes, and other fruit have been an economic boom for California, providing high economic yield on the water used. Almond orchards alone use about 10 percent of all developed water. Alfalfa consumes the most agricultural water, with pasture irrigation ranking third for water consumption. Much of the nut and alfalfa crop is exported out of the country. Agriculture also relies heavily on groundwater, particularly in drought years. Growers with senior rights for surface water have rarely faced cutbacks until recently, although those with junior rights regularly face cutbacks. Metropolitan Water District of Southern California pays farmers to fallow up to 28 percent of their land in order to divert the unused irrigation Colorado River water to cities. Farmland also has been lost due to enlargement of wildlife refuges and water shortages. California clearly has complicated policies and priorities for the retention of farmland to produce food (Agricultural Land Loss & Conservation, www.cdfa.ca.gov).
Residential and business use accounts for about 7 MAF annually, with about half of that going to landscape irrigation (Water Resilience Portfolio, 2019). Urban development is now consuming an average of about 40,000 acres of agricultural land per year. There is also a proliferation of very large rural residences (5-40 acres) that are unlikely to be used for commercial agriculture and tend to be excluded from mandatory landscaping water restrictions in other areas The San Francisco Bay and South Coast regions account for most urban water use in CA. Both rely heavily on imported water from other parts of the state. Since 2010, when per capita use was 180 gallons per day, urban use fell to 146 gallons in 2015, then 59 gallons in 2017, from reduced landscape watering (Water Use in California, Fact Sheet May 2019, Public Policy Institute of California, www.ppic.org).
Water Marketing is also a significant aspect of water allocations. In California’s water market, buyers and sellers trade water through short- and long-term leases and permanent sales of their water rights. Statewide, almost 1.5 MAF are traded annually, or almost 4 percent of all the water used by cities and farms. The state fosters the growth of water trading by both farms and cities, representing nearly 15% of the supply for southern CA cities. Environmental water purchases have also been made to support wildlife refuges, increased flows for fish and replenishing the Salton Sea, representing about 17 percent of the total market from 1982-2017. Those amounts have declined drastically since then. The establishment of groundwater markets is thought to be a way to stabilize the water basins since it requires strong policies, accounting and caps on pumping (California’s Water Market, May 2019, Public Policy Institute of CA, www.PPIC.org/water).
 Existing Water Sources
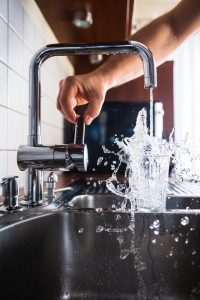
Most of the public turns on their faucets, expecting water, but giving little thought to where that water comes from. There are more sources of water from developed systems and storage reserves than many people realize. This section will describe the system of aqueducts, reservoirs, river basins, including Lake Mead and the Colorado River, groundwater aquifers, and underground storage facilities. It will offer some clarification of the major water managing agencies as well, although complex.
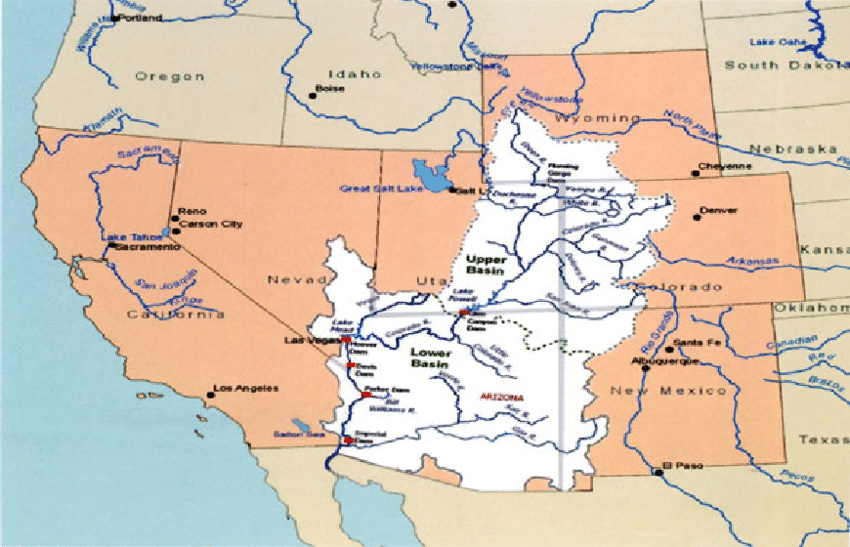
Although mainstream news has raised public alarm bells by the low water levels at Lake Mead Reservoir, southern California has multiple sources of water besides the Colorado River. True, the Colorado River water released by Hoover Dam at Lake Mead is a big piece of the puzzle, supplying seven states in the US – California, Arizona, Nevada in the Lower Basin and Colorado, Utah, Wyoming, New Mexico, and Arizona in the Upper Basin – plus Tribal nations and Mexico. The initial agreement among the seven states was created in 1922, called the Colorado River Compact. Specific allotments have been changed multiple times since then, along with disputes between California with Arizona and Mexico. Little Colorado River water reaches the Colorado Delta in Mexico, which has deteriorated from lack of water and silt deposits. California was allotted the largest share of the lower states with 4.4 MAF per year and access to surpluses. However, population growth, protracted drought, and declining river flows have necessitated re-negotiation of allocations and drought guidelines because there are more allocations than water. In late 2018, the state of CA revised its plans, requiring more water from the Sacramento and San Joaquin rivers to reach the Bay Delta.
The 242-mile-long Colorado River Aqueduct transports water to the LA basin, operated by the Metropolitan Water District of Southern California, representing 8 to 15 % of its water supplies. More than 40 million people depend on Colorado River water, including the above listed seven states, two countries, 9 million acres of farmland, 22 Native American tribes and 11 national parks. Lower basin states experienced rapid growth in the early 1900’s, resulting in growing demands for water. Dams and water systems were constructed by the US Bureau of Reclamation and the states to meet the demands, whereas the northern donating regions worried about their future water rights. The Colorado River Compact of 1922 began to sort out everyone’s fair share, becoming known as the “law of the river.” Water was reserved for Mexico as well in a later treaty in 1944. Negotiations are still on-going (National Parks Service).
The Colorado River Indian Tribes (CRIT) have lands that stretch along 56 miles of the lower Colorado River. The CRIT have nearly 720K feet of water rights, which by law were only to be used on the reservation. However, as a result of recent legal changes ushered in by the Az Drought Contingency Plan (DCP), off-reservation water leasing is now allowed, in order to stabilize water levels in Lake Mead. The CRIT is compensated for up to 150K acre feet of water, and leaves up to 50,000 acre-feet per year in Lake Mead for multiple water supply uses. This project can contribute approximately two feet of water level in the lake (www.businessforwater.org/project/CRIT).
The Central Valley Project (CVP) is another federal project owned by the USBR and operated jointly with the State Water Project (SWP). Beginning with Shasta Dam, and drawing water from both the Sacramento and San Joaquin River basins, the CVP is a complex, multipurpose network of 20 dams, reservoirs, canals, hydroelectric powerplants and other facilities running 400 miles through Central California to Bakersfield. The CVP system can hold up to 12 MAF of water. Shasta, Trinity, Folsom, Millerton and New Melones dams are owned by the US Bureau of Reclamation (USBR) and operated jointly with the SWP. CVP has long term agreements to supply water to 29 CA counties and over 250 contractors. In the past, about 75 to 80 percent of CVP water was used for agricultural irrigation.
In addition to the US Bureau of Reclamation system of dams, reservoirs and canals, southern coastal California cities receive water diversions via the State Water Project (SWP), the Metropolitan Water District of Southern California, three aqueduct systems and groundwater aquifers. The state Department of Water Resources (DWR) manages both the SWP and CVP, which share some common reservoirs but have differing infrastructure and perspectives. Management and water release policies differ from year to year, depending on whether the state or the federal USBR controls the water. And even among the “water experts”, opinions vary about the best way to handle the looming water crisis, demonstrating that water policy is complex. This is part of the reason there is so much disparity in water deliveries, depending on the project, contributing to the sense of “murky politics” of water management.
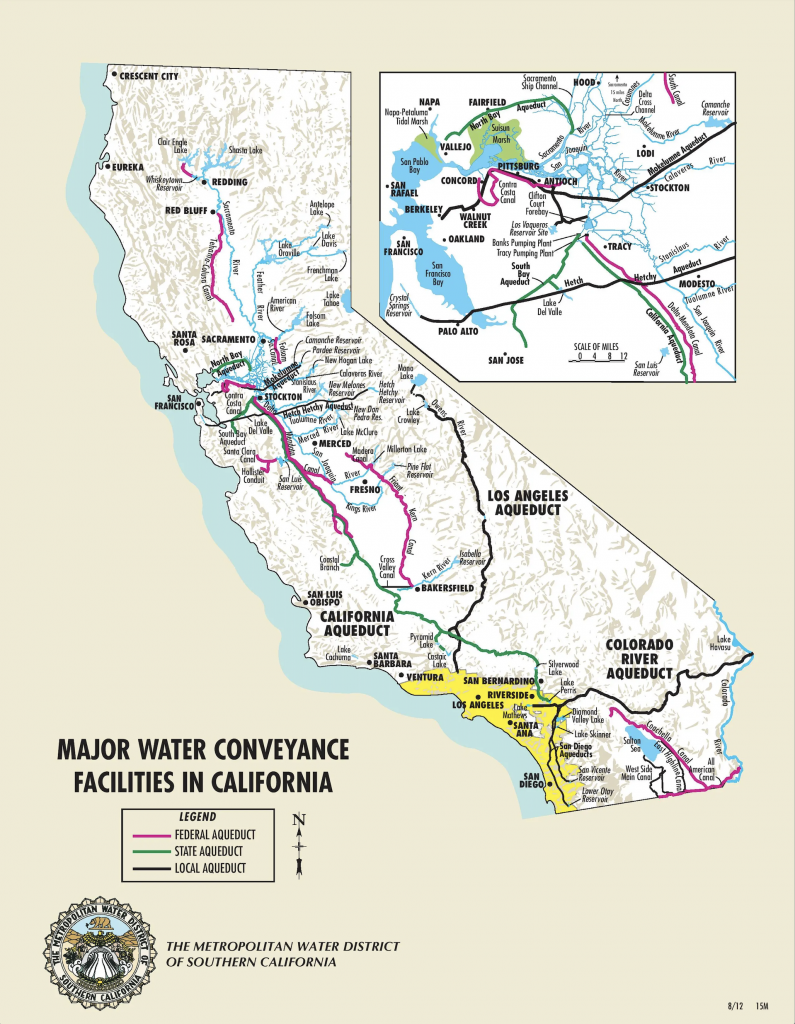
See CVP and SWP Project canals in below image:
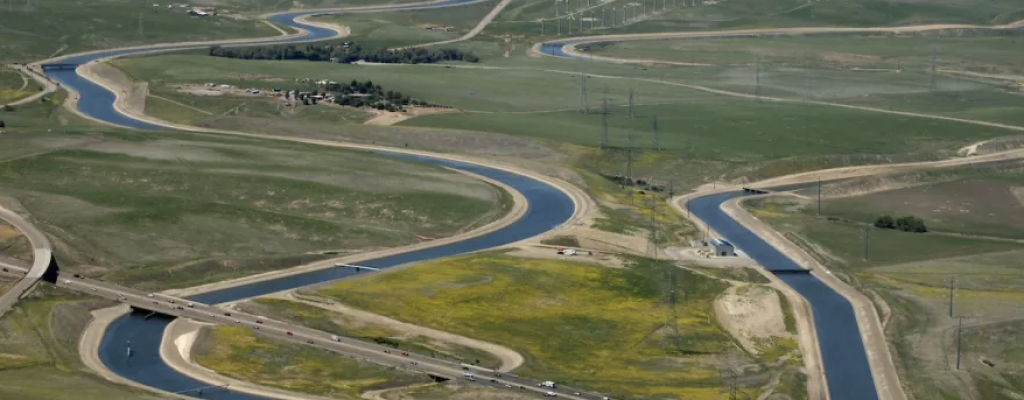
The Los Angeles Basin is fed water by three long aqueducts, as if it was a black hole. Aqueducts include the Eastern Sierras’ Los Angeles Aqueduct from Mono Lake and Owens River, the CVP/SWP California Aqueduct from Oroville and Shasta Lakes and Sacramento Delta, and the Colorado River Aqueduct from Hoover Dam at Lake Mead. Lake Mead is fed by Glenn Canyon Dam at Lake Powell.
The State Water Project diverts water from the Feather and Sacramento Rivers to the Central Valley, South Bay Area and Southern California cities via the California Aqueduct. With construction beginning in 1963 and promoted by Governor Brown, the aqueduct became a 444 miles long system of canals, tunnels and pipelines. The SWP manages 22 dams and reservoirs, the Delta pumping plant and the aqueduct. About 30 percent of the water is used for irrigation, mostly in the San Joaquin Valley and about 70 percent is used for residential, municipal and industrial use, mainly by LA. Water released from Lake Oroville into the Feather River meets up with the Sacramento River and Lake Shasta water, then flows into the Sacramento Delta along with 4 other rivers. Side aqueducts pump water to water agencies along the way. At the Delta, the Banks Pumping Plant diverts water into the California Aqueduct, serving both the SWP and the federal CVP. There is, of course, ongoing concern about protecting the Delta’s ecosystem and sinking of sections along the canal (State Water Project). Water from the West and East branches of the California Aqueduct are stored in lakes surrounding Los Angeles.
The first section of the Los Angeles Aqueduct, built between 1908-1913 by 5,000 construction workers was spearheaded by William Mulholland for the Los Angeles Department of Water and Power (LADWP). It effectively eliminated the Owens Lake ecosystem and as a viable farming community with many accusations of the use of deceptive tactics to force farmers off the land. The first aqueduct ends at Upper Van Norman Lake in Granada Hills. The water allowed development of LA and the San Fernando Valley through World War II. By the 1930’s, thirsty LA began buying more water rights north of Owens Valley in the Lake Mono basin. By 1941 an extension was completed to the first section of the aqueduct that diverted water from various creeks that fed Mono Lake. Years of litigation followed, until 1994 when the state water board (SWRCB) required LADWP to refill Mono Lake to 20 feet. The second Los Angeles Aqueduct begins at Haiwee Reservoir, just south of Owens Lake and runs parallel to the first aqueduct, completed in 1970. Ground water was pumped out of Owens Valley springs for that system.
Underground Water Tables and Reservoirs
Underground aquifers are another critical source of water and largely hidden from urban public awareness. Farmers depend upon them, drawing upon their wells for all water, even if surface water crosses their land, unless they own water rights to it. During normal precipitation years, groundwater provides 30 percent of the state’s water supply as well, but this has risen to as much as 60 percent in drought years. CA has 450 known aquifers, although not all are of usable quality, which require a minimum depth of 808K AF.
Most of the water diverted to southern CA is surface water from northern regions. The state has 10 major drainage basins, divided by mountain crests and containing rivers and watersheds. The largest aquifer is in the Central Valley Basin, draining over 30% of CA and fed by the Sierra Nevada snowpack runoff. It is replenished both naturally and artificially. Much of CA’s extensive reservoir and aqueduct systems are designed to capture runoff from this watershed.
The Los Angeles Basin aquifer is an immense and deep strata of gravel and silt extending 160 square miles in the southwestern part of LA County, supplying 11 cities with water. It’s average annual production is about 52K AF, or 20 percent of all commercial demands. A chain of foothills running from Culver City to Long Beach splits the aquifer into the West Coast Groundwater Basin and the Central Groundwater Basin. The Upper Los Angeles River Area Basin at Tujunga is also important contributor to the LA water supply. Although the South Coast watersheds are the most populous regions of California (SF, LA, SD), they receive relatively little natural runoff, requiring imports of water from other parts of the state.
With no basic laws regulating the extraction of groundwater, accelerated overdraws became critically unsustainable. For example, due to drought, more than 2400 well permits were issued in 2013 in the San Joaquin Valley. In some areas, water table depth fell by up to 100 feet, with regional sinking of land elevation over the past century. Since 1959, the Water Replenishment District of Southern California (WRD) has been responsible for recharging the LA Aquifer. The WRD today is a regional government with a five-member board elected by voters; its constituents are the pumpers who draw water from the two basins. WRD closely monitors what the pumpers remove and what water injection wells put back in. The pumpers pay for managing the system and imported water for recharging. (Beneath Our Feet: Water and Politics in Southeast LA, Sept 2, 2016, www.kcet.org/shows/lost-la).
Every month, WRD staff produces a Groundwater Basin Update report for its Water Resources Committee meetings and can be viewed online at www.wrd.org. The report summaries groundwater levels, reservoir levels, how much water was pumped out from key wells, how much was recharged, and water quality for each basin. As of June 1, 2022, water levels increased in 9 of 21 reservoirs. The largest increase occurred at Lake Powell (0.52 MAF). The largest decrease occurred at Lake Mead (-0.36 MAF) at Lake Mead. These reports are an excellent source of data. It identifies yet another source of water as recycled and treated storm and waste water that is injected into spreading grounds as recharge, captured by the LA County Dept. of Public Works (LACDPW).
Other agencies also regulate groundwater. In 2014, the Sustainable Groundwater Management Act required legislative bodies in each basin to develop sustainability plans to control overdraft and recharge of underground water. This is overseen by the CA State Water Resources Control Board with its Groundwater Ambient Monitoring and Assessment Program (Water in California, www.en.m. wikipedia.org). The state agency responsible for water planning and management is the DWR.
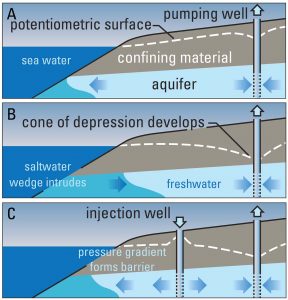 Seawater barriers are a series of injection wells positioned like a dam between the ocean and groundwater aquifers. Without sufficient barriers, seawater would leek into the aquifers, making it too salty to drink. There are two barrier systems for the West Coast Basin that receive recycled and imported water: the West Coast Basin Seawater Barrier and the Dominguez Gap Barrier. The LA County Flood Control District (LACFCD) owns, operates and maintains the barrier projects. The WRD purchases all the water for injection into the barriers, among its other responsibilities described above.
Recharging of the underground water basins is largely done with recycled water. The WRD’s June 1, 2022 Groundwater Update reported that for the fiscal year 21-22 (April), 55, 884 AF of recycled water and 26,075 AF of local water were injected into the basin spreading grounds. The Central Basin pumped out 143,504 AF and the West Coast Basin pumped out 29, 470 AF. The goals of maintaining aquifer quality includes sustaining adjudicated pumping rights, leaving room for future storage projects, and identifying lower limits for quality assurance.
The Headworks Reservoir Complex is a massive $350 million, 110-million-gallon underground reservoir in Griffith Park, LA. It is the size of 4 football fields and is supported by over 300, 30 ft concrete columns to hold down the cement cover. It will eventually be covered up with dirt and parkland. It replaces surface water stored in Silver Lake and Ivanhoe reservoirs to meet water quality standards. It is owned and operated by the LA Dept of Water and Power (LADWP) for the purpose of supplying clean drinking water in compliance with more stringent state and federal regulations. The East Reservoir was completed in 2015 and the West Reservoir is still under construction. The entire complex is scheduled for completion in 2024.
In 2020, the Southern Nevada Water Authority (SNWA) completed and turned on a new $1.5 billion dollar “low lake level pumping station” at Lake Mead. It is the water authority’s third Lake Mead intake station at 875 feet, below the dead pool level of 895 feet. The first two intake stations could not pump below 1050 and 1000 ft water levels. The imported water is most likely stored in the massive and deep carbonite Las Vegas aquifer that has been supporting population growth, resorts and 50 golf courses in the middle of a desert. Aquifer recharging has been occurring since 1990.
Water Resources Summary
The first step in understanding water management is knowledge of the resources, both natural and man-made. There are multiple sources of water and ways of recharging them that few people are fully aware of. Looking only at dropping water levels at Lake Mead and climate change, as promoted by the news media and politicians, creates a simplistic viewpoint on California water management.
Southern coastal cities in California have very little natural water sources and are dependent on imported water and storage systems. However, elaborate systems have been developed, including treating wastewater to recharge massive underground aquifers with recycled water for storage. Groundwater is a critical element and needs to be protected from overdraws. Underground aquifer and storage management systems are in place and are a big part of the total picture. Exporting of massive amounts of water has indeed sacrificed ecosystems and farming in northern parts of the state. Statewide needs for water in all communities and types of users need be part of any solution to the water shortage crisis created by drought.
Perhaps heavy water dependent type crops, such as almonds, in southern California regions needs to be re-examined, even though profitable. The old ways of allocating water, based on senior and junior water rights, is no longer meeting community needs. Furthermore, climate changes, drought, declining river levels in the Colorado River basin, population growth and loss of agricultural land are making revisions and conservation methods absolutely critical for better management decisions. The network of water controllers and decision makers, buyers and sellers, is complex. All of this will be addressed in Part 2 and 3 of this series. Part 2 will be released tomorrow.
For more on the drought scandal, check out this recent video by Jimmy Dore: https://youtu.be/sAhJak7AiIY
Watch this interview with Elaine and Reinette Senum discuss the issue: https://reinettesenumsfoghornexpress.substack.com/p/citizen-sleuth-elaine-buxton-uncovers?utm_source=substack&utm_medium=email#play
And PLEASE circulate this letter from Senator Hurtado who represents the 14th District in California’s Central Valley and contributed to the Clean Water Act. https://sd14.senate.ca.gov/sites/sd14.senate.ca.gov/files/pdf/CA%20Legislature-DOJ%20Water%20Market%20Manipulation%20Letter.pdf

Your Tax Free Donations Are Appreciated and Help Fund our Volunteer Website
Disclaimer: We at Prepare for Change (PFC) bring you information that is not offered by the mainstream news, and therefore may seem controversial. The opinions, views, statements, and/or information we present are not necessarily promoted, endorsed, espoused, or agreed to by Prepare for Change, its leadership Council, members, those who work with PFC, or those who read its content. However, they are hopefully provocative. Please use discernment! Use logical thinking, your own intuition and your own connection with Source, Spirit and Natural Laws to help you determine what is true and what is not. By sharing information and seeding dialogue, it is our goal to raise consciousness and awareness of higher truths to free us from enslavement of the matrix in this material realm.


